
Lab 8 Exercises
In this activity you will learn to identify features of a stream using satellite imagery in Google Earth Pro. You will create a hand-drawn map of the fluvial features you identify along a segment of the Elbow River in Calgary, Alberta on the homelands of the Niitsitapi (the Siksika, Piikani, and Kainai), the Îyârhe Nakoda and Tsuut’ina Nations. Located just south of Mount Royal University’s campus, this segment of the Elbow River was one of the areas affected by the 2013 flooding. Elbow River also plays a crucial role in supplying Calgary’s drinking water.
You have been provided with the following starting materials to complete this mapping activity:
- A base image from Google Earth satellite imagery (Elbow River Map Area) that you must print out
- A digital copy of the 082J-16 NTS Priddis map sheet on which your map area resides (do not print this)
The purpose of your map is to show your reader the locations of erosional and depositional features of the Elbow River. To convey that information in a way that is useful, your map needs to include some standard cartographic elements including:
- Title
- Scale
- North arrow
- Legend
- Sources (e.g., satellite imagery, base map, reference map)
- UTM coordinates for a reference point on your map
- Refrence to the National Topographic System (NTS) map sheet on which your map resides
Title
Your map should have a succinct but descriptive title that includes some reference to the geographic area. This could include the name of the river, the NTS map sheet on which your map resides, or the name of a prominent local landmark that is featured on your map. Your title must also include what type of map you have drawn, e.g., topographic map, geological map, map of glacial landforms, map of population distributions, etc.
Scale
Your map must indicate scale using both a scale bar and a representative fraction. Remember, you can calculate the scale on your map by comparing the length of a distinctive feature on your map and a topographic map of the same area. But first, because you are examining an electronic version of the topographic map on a computer screen rather than a printed version you need to ensure that you are viewing the topographic map at the correct scale (as your device may distort the size of the image on the screen).
To check if your topographic map PDF is being displayed correctly, measure the scale bar on the map. For a 1:50,000 map sheet like the one you are using, 1 cm on the scale bar should represent 500 m on the ground. By holding up a ruler to measure, zoom in and out until this is true on your computer screen before you follow the steps below.
- Measure a feature that is visible and distinctive on both your map and the topographic map. Record your measurements in the same units for both. The distance between intersections along a road, or in a straight line between two distinctive features are good places to measure.
- Use the formula below:
![]()
For example, for a feature 5 cm long on your map and 2.5 cm-long on the 1:50,000 topographic map:
![]()
The scale of the base image in this example is therefore 1:25,000. This result is not particularly realistic as air photo or satellite imagery scales rarely work out to such a nice, even number.
North arrow
Exactly as it sounds: a north arrow on a map shows the reader the direction of north in the area.
Legend
The purpose of a legend is to define all symbols, abbreviations or colours used on a map to the reader. Every feature that you draw or label on your map should be explained or defined in the legend. For example:
| Abbreviation or symbol on the map | Meaning |
| Fp
Ms ——- |
Flood plain
Meander scar Trail |
Feel free to create your own abbreviations or symbols for features on your map, but make sure you choose unique abbreviations or symbols for each feature.
Reference location
To help your reader put the information from your map into a real-world context, you should provide the UTM coordinates for a reference location on your map. You may want to refresh your memory on grid coordinates by reviewing the Google Earth Tutorial. This location should be something visible and distinctive on both your map and the topographic map provided. Furthermore, this location should be a feature that is unlikely to move over time, e.g., a point bar would be a poor choice as the shape and position of the point bar migrates over time. You will also need to tell your reader where your mapped area fits into Canada’s National Topographic System (NTS).
Instructions
1. Examine the area you will be mapping (Elbow River Map Area).
2. Open Google Earth Pro on your computer and navigate to this area. Spend some time examining the features of this area using the 3D capabilities of Google Earth Pro.
3. Attach a piece of tracing paper to your printed satellite imagery with a paper clip or piece of clear tape. Be gentle; tracing paper tears easily! Be very careful when erasing!
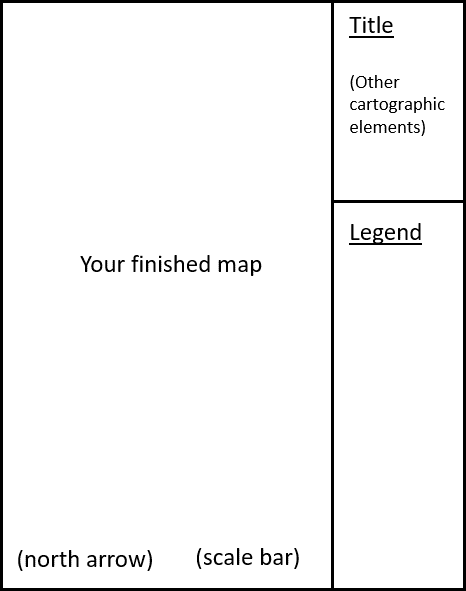
4. Set up your map area. Make sure that you have enough space on your tracing paper set aside for your legend and other cartographic elements (see checklist below). The example shown here illustrates one possible layout, but feel free to choose a layout that works with your map area.
5. With a pencil, lightly and neatly draw in the major landforms that you see in the satellite imagery. Focus on fairly large-scale structures; don’t clutter up your map with a lot of detail. Think about what features are relevant to the fluvial features map you are drawing, and then make a judgement call for yourself about what features to include. For example, is it important to your map to draw in every building? Or to highlight areas with different types of vegetation? Probably not. But is it important to have a few key roads on your map to help a reader situate your map? Yes, it is.
6. Think about neatness. Examine the topographic map provided. What characteristics make it neat and easy to read? It is drawn carefully and the features are not shaded in. Remember: you are producing a map, which is drawn in plan view. It should not have any 3D aspect to it, including shading. Your finished product should be a line drawing only.
7. Use the topographic map provided to help you identify named geographic features.
8. Trace out the different fluvial features that you have interpreted, and assign each feature a unique abbreviation or symbol. Keep track of the abbreviations or symbols that you use on a spare sheet of paper to help format your legend once you have finished your map.
9. If the feature you are tracing is a polygon (an enclosed area that defines the borders of the specific feature), make sure your polygon is fully closed and labeled with an abbreviation, symbol or colour. Make sure every polygon you draw is labeled.
10. Review the checklist below and ensure that your finished map contains all the required information.
| Fluvial Features | Cultural Features | Cartographic Elements |
| Active channel | Roads | Title |
| Cut bank | Bridges | North arrow |
| Point bar | Buildings or subdivisions | Scale bar |
| Abandoned channel | Scale as representative fraction | |
| Oxbow lake | Legend | |
| Delta | Reference to NTS sheet on which this map resides | |
| Flood plain | Reference point in UTM coordinates | |
| Meander scar | Elevation of reference point in metres (estimate using the topographic contours) | |
| Date of satellite imagery and source of satellite imagery | ||
| Author’s name (your name) |
Summary Questions
1. What is the National Topographic Index Number for the topographic map provided?
2. What is the National Topographic Index Number for the topographic map directly to the north of this map?
3. What colour are grid lines for UTM Zone 11 on the topographic map sheet provided?
4. What colour are the topographic contour lines on the topographic map sheet provided?
5. What is the contour interval (C.I.) on this topographic map?
6. Examine the spacing between adjacent contour lines on the topographic map provided. In what general part of the map do you see relatively steep topography? In what general part of the map do you see relatively gentle topography? How can you tell the difference using the contour lines?
7. Draw a sketch of a few contour lines, with elevations labeled, as they cross a stream. On your sketch, indicate the direction of stream flow with an arrow.
8. Where would you expect to find the fastest water flow on a straight stretch of a stream?
9. Sand grains can be moved by traction and saltation. What minimum stream velocities might be required to move 1 millimetre sand grains?
10. Under what circumstances might a braided stream develop?
11. What do you think controls the variability in the colour of the water in Glenmore Reservoir in this satellite image?
12. What factors or forces influence the behaviour of the Elbow River? Hint: Examine the most recent satellite imagery for your map area in Google Earth Pro.
If you have the opportunity to do so, and provincial health authorities deem it safe, you are encouraged to safely and respectfully visit this area, called Weaselhead Flats, yourself. Walk around the Weaselhead Flats and see what fluvial features you can identify in person. Grab a handful of sediment from a point bar and examine the size, shape and composition of the grains. As for any field work, always:
- Stay on the trails, be mindful of other trail users and maintain 2 m of physical distancing.
- Dress appropriately for changing weather conditions. Think layers!
- Bring water, a hat and sunscreen.
- Wear appropriate footwear that covers your foot completely, provides some ankle support, and has a good tread in case the path is slippery.
- If you are exploring along the river bank, walk cautiously and be mindful of loose soil or sediment that may collapse.
- Make a plan! Make sure you tell someone when you are expected home and check in with them once you return.
Media Attributions
- Elbow River Map Area and Glenmore Reservoir and area satellite images used under the following Google Maps and Google Earth guidelines.
- 082J-16 NTS Priddis topographic map: © Natural Resources Canada. The Government of Canada retains the copyright of this image but allows for reproduction for non-commercial use.
- Example map layout: © Siobhan McGoldrick. CC BY.
standard elements on a map that help the reader understand what is being presented and how it relates to places and distances in the real world
