
Lab 1 Exercises
Activity I: Plate Boundary Characteristics
In this activity you will learn to identify types of plate boundaries based on the characteristics they exhibit. This activity is based on the “Discovering Plate Boundaries” activity by Dale S. Sawyer at Rice University and modified based on teaching experiences at the SEOS department of the University of Victoria, Canada.
In groups, we will examine five types of plate boundaries today:
-
- Ocean-Ocean Divergent (the boundary between two plates where oceanic crust is being pullled apart)
- Ocean-Ocean Convergent (where two plates of oceanic crust are moving toward one another leading to the subduction of one plate)
- Ocean-Continent Convergent (where oceanic and continental crust are moving toward one another leading to the subduction of the oceanic crust)
- Continent-Continent Convergent (where two plates of continental crust are moving toward one another)
- Ocean-Ocean Transform (where oceanic crust is moving horizontally in opposite directions across a transform fault)
To start, download or view the plate boundaries map. Seven plate boundaries are highlighted and numbered on your map. You will also be assigned a map displaying one of four data sets: volcanoes, earthquakes, topography/bathymetry, and seafloor age.
You will each, individually, study your data set and attempt to draw conclusions about what geological features and processes characterize each of the numbered plate boundaries.
Later in lab today, you will be joining a live video conference in small groups to share your observations with your group mates. You will be asked to summarize your observations so write down your conclusions and be prepared to teach your peers!
Step 1
Examine your assigned map. Start by locating all the numbered plate boundaries on your assigned map. Are they easy or difficult to find? Looking closely at your data type, start making notes about the spatial distribution of the data points. Exactly what you look for will vary with data type. For the point data (volcanoes and earthquakes) you are looking for distribution patterns. For surface data (topography and seafloor age) you are looking for where the surface is high and where it is low, where it is old and where it is young. In this activity you are focusing on observations, not interpretations, meaning that you do not need to worry about why there is or is not a pattern, you just need to observe and record what you see. You are analyzing the data, not interpreting them!
Step 2
Now focus your attention on the numbered plate boundaries on the plate boundaries map. Identify the nature of your data near each of the numbered plate boundaries. Is it high or low, symmetric or asymmetric, missing or not missing, varying along the boundary or constant along the boundary, etc. Complete Table 1.1 below to classify the plate boundaries based on your observations of your assigned data, using the tips below for guidance. Right now, you will only fill in the column for your assigned data set. Remember: do not try to explain the data; just observe!
Below are some suggestions for the kinds of observations that are useful for each data set. Compare your boundary to the types of boundaries on the map as you do this. Remember, the goal is to find unique characteristics for each boundary type.
Volcanoes: Observe and make notes on the distribution patterns. Are the volcanoes near a given boundary randomly distributed, tightly clustered, or do they define a linear trend?
Earthquakes: Observe and make notes on the distribution patterns and depth of the earthquakes. Note both the range of depths (extremes) and the more typical or average. For example, a given boundary might have all shallow earthquakes (0- 33 km) with rare deeper earthquakes between 33 -70 km depth. Earthquakes might be randomly distributed, tightly clustered, or may define a linear trend.
Topography/bathymetry: Look for any topographic features that seem to be related to the boundary, such as nearby mountain chains, deep sea trenches, broad gradual highs or lows, offset (broken and shifted) features, etc. Briefly describe how extreme they are (e.g., a very high or wide mountain chain). Make sure that you understand how the colour scale on the map represents elevations above sea level. For example, your should recognize that bright fuchsia colours correspond to large negative values and represent the deepest parts of ocean where the seafloor is far beneath sea level.
Seafloor age: This data set can be tricky; be careful not to see patterns where there are none! For example, you might observe that in some places, the seafloor age changes from place to place along the boundary. In this case there is no clear pattern and this indicates no relationship between seafloor age and the boundary, but this is still a good observation! Alternately, the seafloor age may be the same everywhere along the boundary, or it may change in a consistent pattern. Do your best to describe what you see, and whether or not your observations fit a clear, consistent pattern.
| Boundary Type | Volcanism | Earthquake Activity | Bathymetry/Topography | Seafloor Age |
| Ocean-Ocean Convergent
(#1 and #2)
|
|
|||
| Ocean-Ocean Transform
(#3)
|
|
|||
| Ocean-Ocean Divergent
(#4 and #6)
|
|
|||
| Ocean-Continent Convergent
(#5)
|
|
|||
| Continent-Continent Convergent
(#7)
|
|
Step 3
Everyone has been randomly assigned to a group and provided with a link to a video meeting to discuss your observations in real time in groups of four. Each group has at least one representative of each data set. Consider yourselves a group of experts gathering to compare observations. In your group, introduce yourself and what type of data you have been analyzing. Taking turns, each group member will share their observations about their assigned data set from Step 2. It is helpful to share your screen while you teach, so that your group members can see your data. If you are not sure how to share your screen, ask your instructor. Your instructor will periodically join each group video meeting group to check in while you complete this part of the activity.
Work together in your group to complete Table 1.1 by summarizing your observations on the characteristics of each type of plate boundary. By the end of this activity, each member of your group should have a completed Table 1.1. Each group member should be able to describe the characteristics of each type of plate boundary using all four data types.
Activity II: Hot Spot Volcanoes and Plate Motion
In this activity you will use data from chains of hot spot volcanoes in Google Earth Pro to make a rough estimate of the rate of motion of the Pacific Plate, and to determine the direction of plate motion for several different tectonic plates. This activity and the Google Earth data provided are based on the “Determining Plate Rates From Hot Spot Tracks Using Google Earth” activity developed by Susan Schwartz and Erin Todd at the University of California-Santa Cruz.
Step 1
Download the Hawaii-Emperor.kmz file provided by your instructor to examine hot spot volcanoes in Google Earth Pro. Load the file into Google Earth Pro by double-clicking on the file, or in Google Earth Pro by clicking on File, Open and navigating to where you saved the .kmz file.
Step 2
Once the Hawaii-Emperor.kmz is loaded, click and drag to move it from “Temporary Places” to “My Places.” Then save “My Places” by clicking File, Save, Save My Places. This .kmz file will now be available every time you open Google Earth Pro on this computer. **NOTE: When you close the program, Google Earth Pro should save everything in “My Places”, but to be safe you should manually save “My Places” to your computer whenever you make significant changes to it.
Step 3
Examine the data in the Hawaii-Emperor.kmz file to answer the questions below. Each place marker indicates a location where a volcanic rock was sampled and dated. This type of dating uses radioactive elements in the rock to give geologists a precise age of when the lava cooled and solidified to form a volcanic rock. The number next to each place marker is the age of the rock in millions of years (Ma). The current location of the hot spot at Kilauea Volcano in southeast Hawai’i is shown by the marker labeled 0 Ma.
Hot Spot Volcanoes and Plate Motion Exercise Questions
1. Using what you learned in the Google Earth Tutorial, list the lat/long coordinates of Kilauea Volcano, Diakakuji Seamount (located at the bend in the Hawaii-Emperor chain), and Midway Island.
2. Using what you learned in the Google Earth Tutorial, list the UTM coordinates of Mauna Kea (located near the centre of the island of Hawai’i), the 75.82 Ma volcano near Detroit Seamount (located near the northern end of the Hawaii-Emperor chain), and the 5.77 Ma volcano on Kaua’i. Remember to include the zone at the beginning of the coordinate!
3. Using the ruler tool in Google Earth Pro, found in the top toolbar, measure the distance between the present location of the hot spot at Kilauea Volcano and Midway Island in kilometers (km). Measure the distance as a line from the point of each pin and round to the nearest whole km.
4. Make a rough estimate of the average rate of motion for the Pacific Plate in kilometres per million years. To do this, divide the distance between two volcanoes along the chain by their difference in ages (shown in millions of years, Ma). The rate is calculated as the distance over time. Round to the nearest tenth.
5. Most plate rates reported in scientific literature are measured in cm/yr. Convert your estimated rate to cm/yr. Again, round your result to the nearest tenth. Remember this calculation is a rough estimate!
6. Examine the entire length of the Hawaii-Emperor chain. What do you think might have caused this chain to form such a distinctive “elbow-like” shape?
Download the HotspotVolcanism.kmz file provided by your instructor and load it into Google Earth Pro. Remember to save it in “My Places” once it is loaded into Google Earth Pro! Notice that this file includes the locations of boundaries between tectonic plates as well as place markers and ages for volcanoes along several hot spot chains (or tracks) around the world.
7. Based on the hot spot tracks shown in the HotspotVolcanism.kmz file and the ages of the volcanoes, determine the direction of plate motion for the African, Australian, Nazca, North American, and Pacific plates. Match the plate name to the arrow that most closely illustrates the vector (direction) of motion.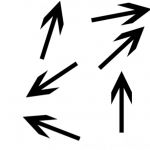
8. Predict whether the plate boundary between the following pairs of plates is convergent or divergent based on the plate motion determined from the hot spot tracks:
a) Pacific & Nazca Plates
b) South American & African Plates
See Appendix 3 for answers to lab exercises.
Media Attributions
- Maps of plate boundaries, topography/bathymetry, seismology, volcanology, seafloor age by Dale S. Sawyer, Discovering Plate Boundaries activity. All rights reserved. Used with permission.
- Google Earth kmz file by Susan Schwartz and Erin Todd, CC-BY-NC-SA 3.0
- Determining Plate Rates From Hot Spot Tracks Using Google Earth activity Title, by Siobhan McGoldrick, CC-BY-NC-SA 4.0. Derivative of Student Handout for Plate Rate Assignment by Susan Schwartz and Erin Todd, Determining Plate Rates From Hot Spot Tracks Using Google Earth activity, CC-BY-NC-SA 3.0
- Arrow figure, adapted by Siobhan McGoldrick, CC-BY-NC-SA 4.0. Derivative of figure by Susan Schwartz and Erin Todd, Determining Plate Rates From Hot Spot Tracks Using Google Earth activity, CC-BY-NC-SA 3.0
a plate boundary at which the two plates are moving towards away from each other
a plate boundary at which the two plates are moving towards each other
a boundary between two plates that are moving horizontally in opposing directions with respect to each other