
1.1 Discovering Plate Tectonics
As we discovered in the introduction to this lab manual, plate tectonics is the model or theory that we use to understand how our planet works. More specifically it is a model that explains the origins of continents and oceans, folded rocks and mountain ranges, igneous and metamorphic rocks, earthquakes, volcanoes, and continental drift. Plate tectonics was first proposed just over 100 years ago, but did not become an accepted part of geology until about 50 years ago. It took 50 years for this theory to be accepted for a few reasons. First, it was a true revolution in thinking about Earth, and that was difficult for many established geologists to accept. Second, there was a political gulf between the main proponent of the theory Alfred Wegener (from Germany) and the geological establishment of the day, which was mostly centred in Britain and the United States. Third, the evidence and understanding of Earth that would have supported plate tectonic theory simply didn’t exist until the middle of the 20th century. Before we delve into the details of plate tectonics, we need to examine some historical context to understand how this theory developed over the course of the 20th century.
Most of the key evidence for plate tectonics came from studying the ocean floor. Before 1900, we knew virtually nothing about the bathymetry and geology of the oceans. By the end of the 1960s, we had detailed maps of the topography of the ocean floors, a clear picture of the geology of ocean floor sediments and the solid rocks underneath them, and almost as much information about the geophysical nature of ocean rocks as of continental rocks. Some of the most influential discoveries by geoscientists in the 20th century that have shaped modern plate tectonic theory are briefly summarized below.
The 1920s to 1950s
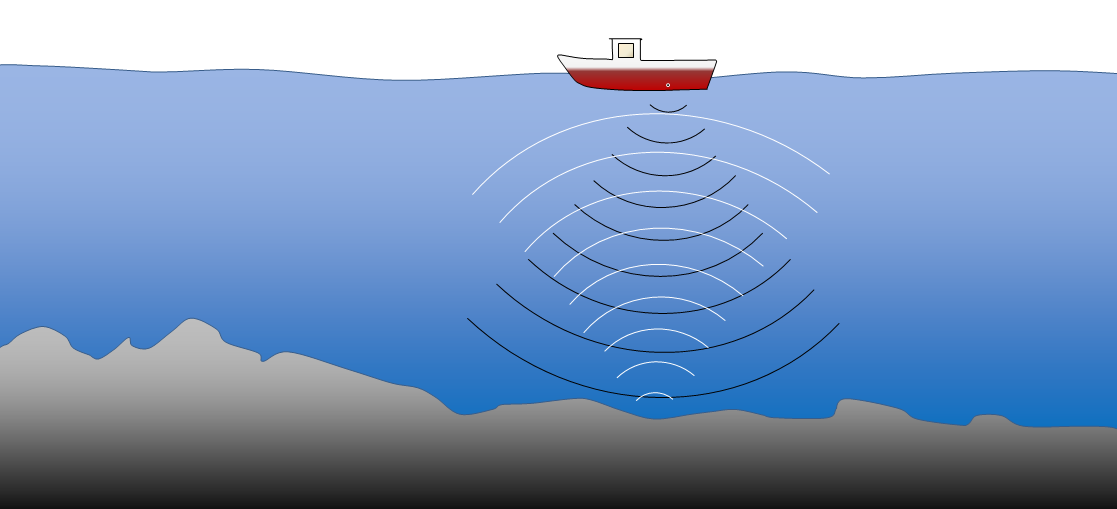
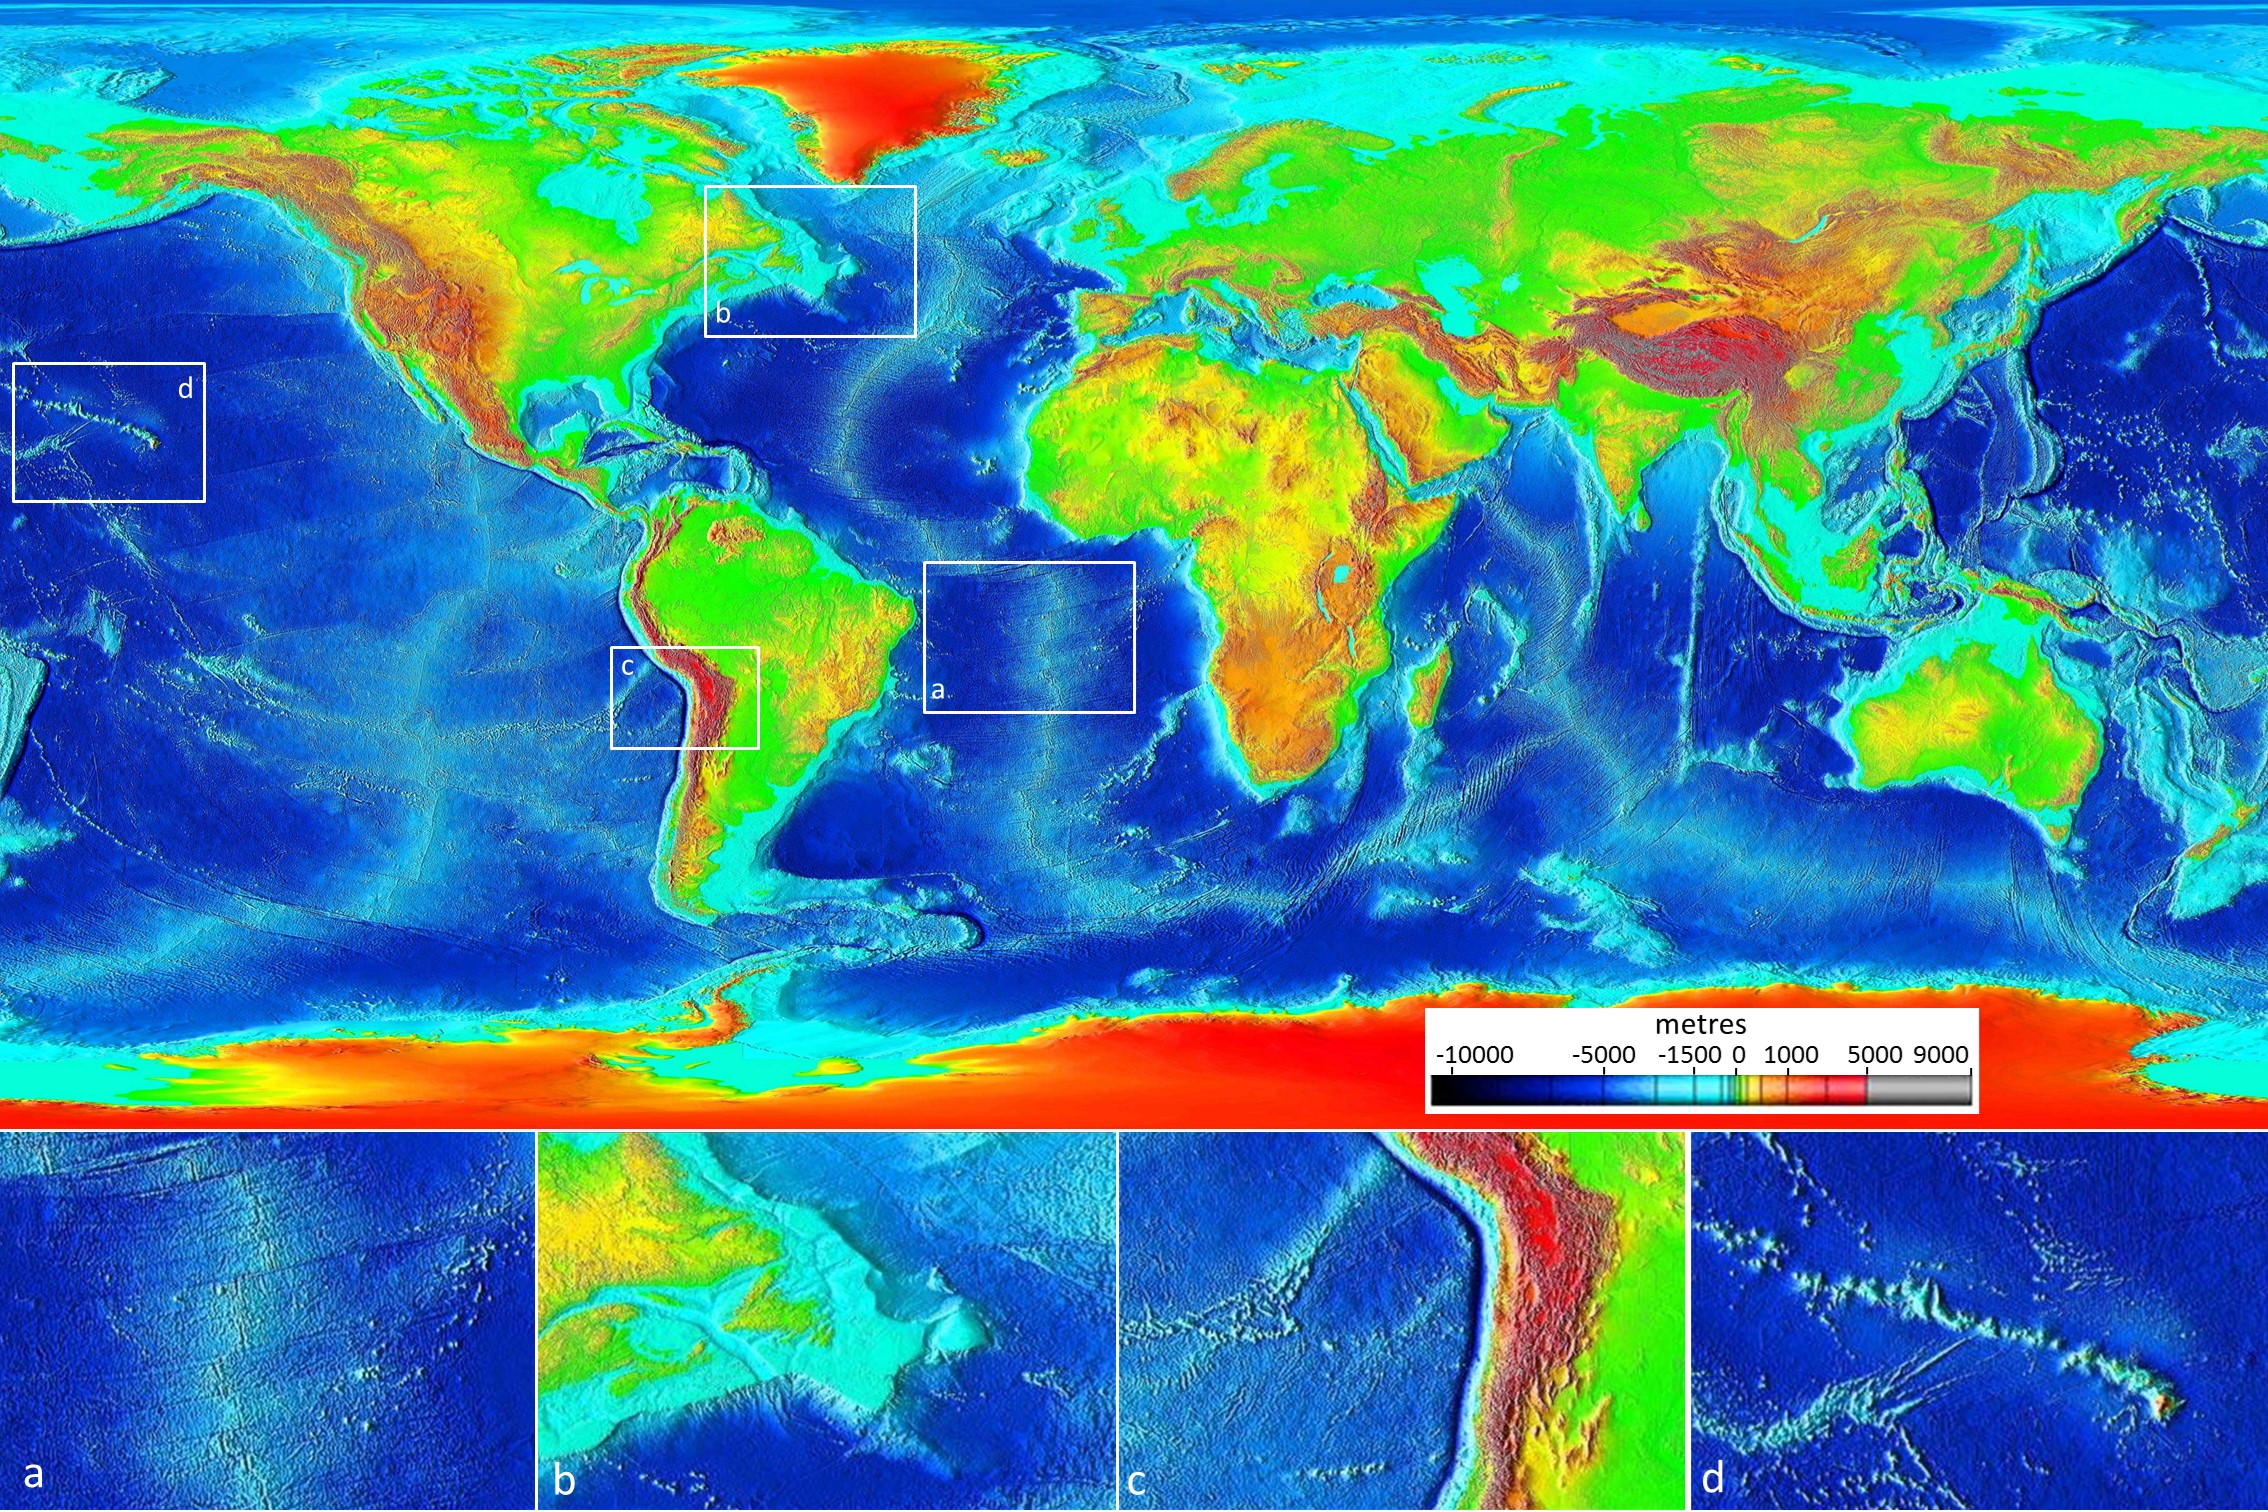
Development of acoustic depth sounders to map the ocean floor (Figure 1.1.1) leads to discovery of major mountain chains in all of the world’s oceans. During and after World War II, there was a well-organized campaign to study the oceans, and by 1959, sufficient bathymetric data had been collected to produce detailed maps of all the oceans (Figure 1.1.2).
The important physical features of the ocean floor are:
- Extensive linear ridges (commonly in the central parts of the oceans) with water depths in the order of 2,000 to 3,000 m (Figure 1.1.2, inset a)
- Fracture zones perpendicular to the ridges (inset a)
- Deep-ocean plains at depths of 5,000 to 6,000 m (insets a and d)
- Relatively flat and shallow continental shelves with depths under 500 m (inset b)
- Deep trenches (up to 11,000 m deep), most near the continents (inset c)
- Seamounts and chains of seamounts (inset d)
With developments of networks of seismograph stations in the 1950s, it became possible to plot the locations and depths of both major and minor earthquakes with great accuracy. It was found that there is a remarkable correspondence between earthquakes and both the mid-ocean ridges and the deep ocean trenches. In 1954 Gutenberg and Richter showed that the ocean-ridge earthquakes were all relatively shallow, and confirmed what had first been shown by Benioff in the 1930s — that earthquakes in the vicinity of ocean trenches were both shallow and deep, but that the deeper ones were situated progressively farther inland from the trenches (Figure 1.1.3).
![Figure 1.1.3: Cross-section through the Aleutian subduction zone with a depiction of the increasing depth of earthquakes “inshore” from the trench. [Image Description]](https://openeducationalberta.ca/practicalgeology/wp-content/uploads/sites/66/2020/06/trench-quakes.png)
Another key component in the case for plate tectonics came from studies of remnant magnetism in the rocks that make up the ocean crust. Usually, remnant magnetism is caused by the presence of ferrous (unoxidized) iron on the seafloor, often from a volcanic rock containing grains of magnetite (Fe3O4), a highly magnetic mineral. As the mineral magnetite crystallizes from magma, it becomes magnetized with an orientation parallel to that of Earth’s magnetic field at that time. Rocks like basalt, which cool from a high temperature and commonly have relatively high levels of magnetite (up to 1 or 2%), are particularly susceptible to being magnetized in this way, but even sediments and sedimentary rocks, as long as they have small amounts of magnetite, will take on remnant magnetism because the magnetite grains gradually become reoriented following deposition.
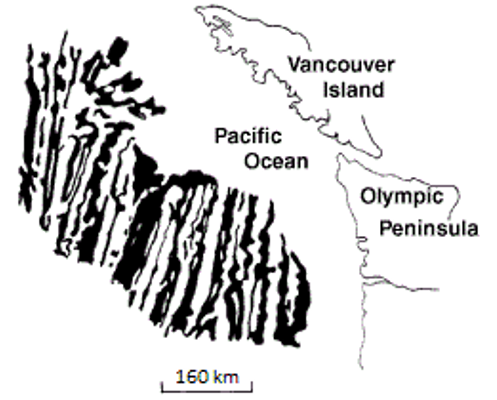
In the 1950s, scientists from the Scripps Oceanographic Institute in California persuaded the U.S. Coast Guard to include magnetometer readings on one of their expeditions to study ocean floor topography. The first comprehensive seafloor paleomagnetic data set was compiled in 1958 for an area off the coast of B.C. and Washington State. This survey revealed a bewildering pattern of low and high magnetic intensity in seafloor rocks (Figure 1.1.4). When the data were first plotted on a map in 1961, nobody understood them — not even the scientists who collected them. But these paleomagnetic data became a key piece of evidence for seafloor spreading.
The 1960s
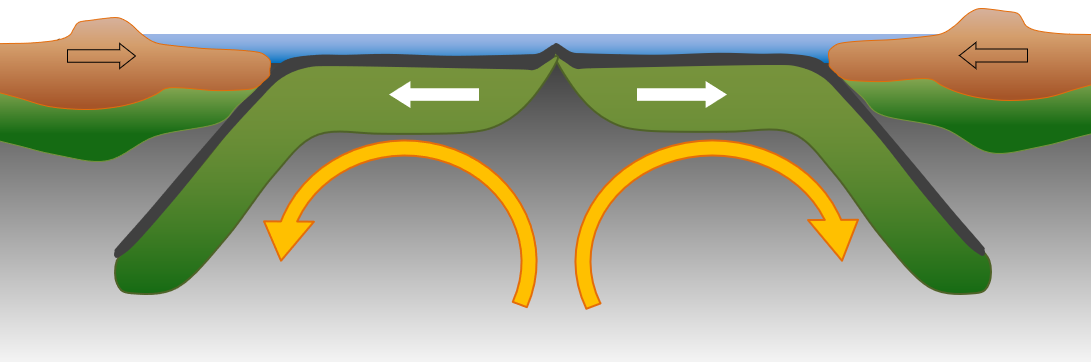
In 1960, Harold Hess, a widely respected geologist from Princeton University, advanced a theory with many of the elements that we now accept as plate tectonics. Hess proposed that:
- new sea floor was generated from mantle material at the ocean ridges,
- old sea floor was dragged down at the ocean trenches and re-incorporated into the mantle,
- plate tectonics are driven by mantle convection currents, rising at the ridges and descending at the trenches (Figure 1.1.5),
- the less-dense continental crust did not descend with oceanic crust into trenches, but that colliding land masses were thrust up to form mountains.
Hess’s theory formed the basis for our ideas on seafloor spreading and continental drift, but it did not deal with the concept that the crust is made up of specific plates. Although the Hess model was not roundly criticized, it was not widely accepted (especially in the U.S.), partly because it was not well supported by hard evidence.
In 1963, J. Tuzo Wilson of the University of Toronto proposed the idea of a mantle plume or hot spot—a place where hot mantle material rises in a stationary and semi-permanent plume, and affects the overlying crust. He based this hypothesis partly on the distribution of the Hawaiian and Emperor Seamount island chains in the Pacific Ocean (Figure 1.1.6). The volcanic rock making up these islands gets progressively younger toward the southeast, culminating with the island of Hawaii itself, which consists of rock that is almost all younger than 1 Ma. Wilson suggested that a stationary plume of hot upwelling mantle material is the source of the Hawaiian volcanism, and that the ocean crust of the Pacific Plate is moving toward the northwest over this hot spot. Near the Midway Islands, the chain takes a pronounced change in direction, from northwest-southeast for the Hawaiian Islands and to nearly north-south for the Emperor Seamounts. This change is widely ascribed to a change in direction of the Pacific Plate moving over the stationary mantle plume, but a more plausible explanation is that the Hawaiian mantle plume has not actually been stationary throughout its history, and in fact moved at least 2,000 km south over the period between 81 and 45 Ma.[1]
In addition to his contributions on mantle plumes and plate motion, Wilson also introduced the idea that the crust can be divided into a series of rigid plates in a 1965 paper, and thus he is responsible for the term plate tectonics.
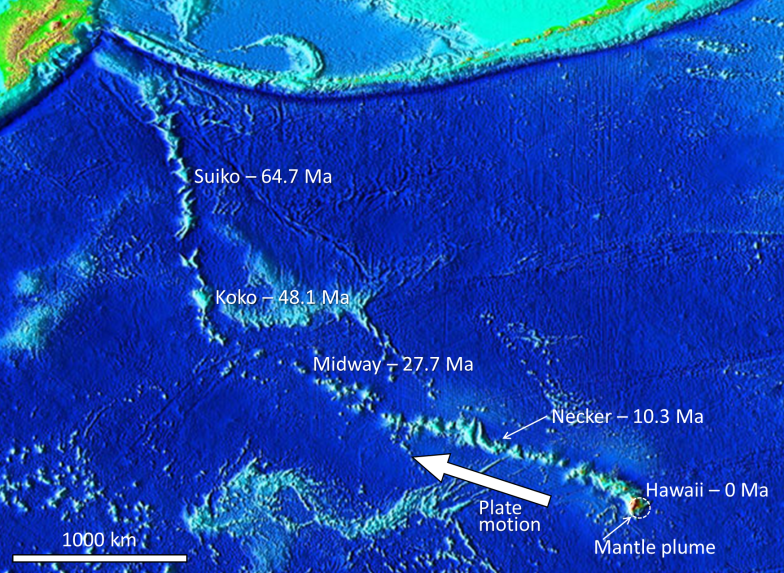
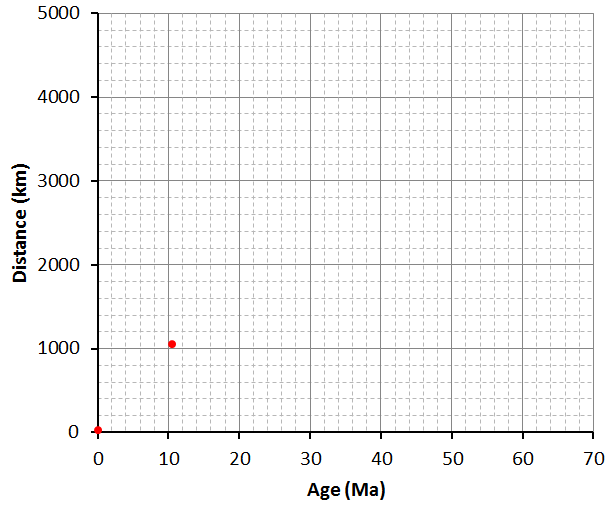
Practice Exercise 1.1 Volcanoes and the Rate of Plate Motion
The Hawaiian and Emperor volcanoes shown in Figure 1.1.6 are listed in the table below along with their ages and their distances from the centre of the mantle plume under Hawaii (the Big Island).
| Island | Age | Distance | Rate |
|---|---|---|---|
| Hawaii | 0 Ma | 0 km | – |
| Necker | 10.3 Ma | 1,058 km | 10.2 cm/y |
| Midway | 27.7 Ma | 2,432 km | |
| Koko | 48.1 Ma | 3,758 km | |
| Suiko | 64.7 Ma | 4,860 km |
Plot the data on Figure 1.1.7, and use the numbers in the table to estimate the rates of plate motion for the Pacific Plate in cm/year. (The first two are plotted for you.)
See Appendix 2 for Practice Exercise 1.1 answers.
There is evidence of many such mantle plumes around the world (Figure 1.1.8). Most are within the ocean basins—including places like Hawaii, Iceland, and the Galapagos Islands—but some are under continents. One example is the Yellowstone hot spot in the west-central United States, and another is the one responsible for the Anahim Volcanic Belt in central British Columbia. It is evident that mantle plumes are very long-lived phenomena, lasting for at least tens of millions of years, possibly for hundreds of millions of years in some cases.
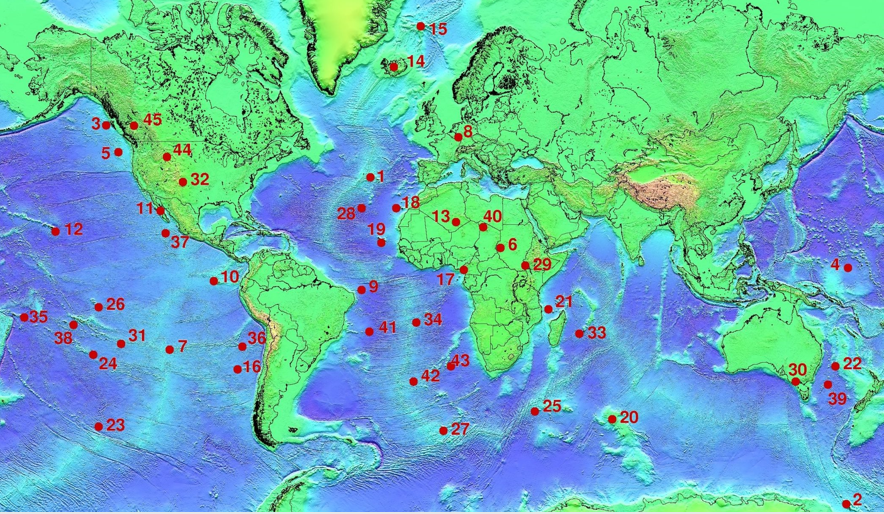
Image Descriptions
Figure 1.1.3 image description: A cross section of the trench formed at the Aleutian subduction zone as the Pacific plate subducts under the North American plate in the middle of the Pacific Ocean. The farther away an earthquake is from this trench (on the North America plate side), the deeper it is. [Return to Figure 1.1.3]
Media Attributions
- Figures 1.1.1, 1.1.3, 1.1.5, 1.1.7: © Steven Earle. CC BY.
- Figure 1.1.2: “Elevation” by NOAA. Adapted by Steven Earle. Public domain.
- Figure 1.1.4: “Juan de Fuca Ridge” by USGS. Adapted by Steven Earle. Public domain. Based on Raff, A. and Mason, R., 1961, Magnetic survey off the west coast of North America, 40˚ N to 52˚ N latitude, Geol. Soc. America Bulletin, V. 72, p. 267-270.
- Figure 1.1.6: “Hawaii Hotspot” by National Geophysical Data Center. Adapted by Steven Earle. Public domain.
- Figure 1.1.8: “Hotspots” by Ingo Wölbern. Public domain.
- J. A. Tarduno et al., 2003, The Emperor Seamounts: Southward Motion of the Hawaiian Hotspot Plume in Earth’s Mantle, Science 301 (5636): 1064–1069. ↵
Station containing seismographs, which are instruments used to measure the vibrations produced by earthquakes. Data recorded by a seismograph are used to pinpoint the exact location and depth of an earthquake.
magnetism of a body of rock that formed at the time the rock formed and is consistent with the magnetic field orientation that existed at that time and place
an instrument used to measure the intensity of a magnetic field
past variations in the intensity and polarity of the Earth’s magnetic field
the formation of new oceanic crust by volcanism at a divergent plate boundary
The concept that the Earth’s crust and upper mantle (lithosphere) is divided into a number of plates that move independently on the surface and interact with each other at their boundaries.
the concept that tectonic plates can move across the surface of the Earth
a region of the lithosphere that is considered to be moving across the surface of the Earth as a single unit
a plume of hot rock (not magma) that rises through the mantle (either from the base or from part way up) and reaches the surface where it spreads out and also leads to hot-spot volcanism
the surface area of volcanism and high heat flow above a mantle plume

#/media/File:Hawaii_hotspot.jpg)