
9.2 Geological Maps
As we learned in Lab 8, the purpose of a map is not limited to navigation. A geological map is arguably the most important tool a geologist uses to understand the Earth. Geological maps are used to convey information about where measurements were recorded in the field, to show the ages, distribution and orientation of rocks, and to locate important geological features like faults. While geological maps only show what is exposed on the surface of the Earth, they are used as a tool to help geologists interpret the geology of the subsurface. You will learn more about this in Lab 10.
Geologists use geological maps as a tool to answer a number of questions, such as:
- Where can we find a particular geological feature, like a notable shale bed rich in dinosaur fossils or the contact between two rock layers of interest?
- What is the geological history of this area, and how has it changed throughout geologic time?
- Are there potential geologic hazards like volcanoes, sinkholes, areas prone to landslides, or faults, in this area? How can this information be conveyed to the public?
- Where can we find mineral deposits or energy resources, and how can we safely extract them?
- How can we better understand and visualize the geology below the Earth’s surface?
Geological maps: the intersection of geology and topography
Geological maps are often drawn as an overlay on top of a topographic base map to be easily linked to local geographic landmarks. Geological maps, therefore, display many of the same cartographic features as topographic maps, including: contour lines, map scale, north arrow, and a legend.
The map patterns on a geological map and the geology we can observe on the Earth’s surface are influenced by topography. Imagine a geological map in an area where strata are horizontal and where the topography is completely flat. How would the geological map of this area look? Now imagine the same geology (strata are horizontal) but in an area with rugged, mountainous topography. How would the geological map of this area look? These questions may seem abstract now, but with practice you will be able to picture how the map pattern on a geological map varies with topography and the attitude of the strata.
For example, examine the three panels of Figure 9.2.1. Each panel shows the plan view and the corresponding block model for three areas with different topography. Notice that the geology, meaning the strata and their attitude, is the same in all three panels. All three show four distinct layers that are horizontal, with 0° of dip. The map patterns differ dramatically even though the actual orientation of the rocks has not changed. Figure 9.2.1 highlights how geological maps show the interaction between geology and topography.

It is important to remember that geology also affects topography. The nature of the topography in an area is strongly influenced by the relative strength of the geologic materials at and below the surface. For example, steep cliffs tend to form in relatively strong rocks that are resistant to weathering, whereas depressions might indicate the presence of a fault, or that the area is underlain by rocks that are more susceptible to weathering. In this way, topography can provide clues (although not definitive answers!) about the nature of the bedrock geology.
What is “mappable”?
Most geological maps do not show the distribution of every rock type separately as this would produce a chaotic map with too much information to be of use. Instead, the map patterns drawn on a geological map are those of mappable units. A mappable unit is informally defined as being:
- Distinct from the units above and below it
- Extensive enough to be shown on a map (think about map scale!)
Geologists who study sedimentary rocks, in particular, need ways to divide them into manageable units, and they also need to give those units names so that they can easily be referred to and compared with other rocks deposited in other places. The International Commission on Stratigraphy (ICS) has established a set of conventions for grouping, describing, and naming sedimentary rock units. In North America, these units are defined by the North American Stratigraphic Code. In order of decreasing scale, the conventional names for these units are: groups, formations, members, and beds (sedimentary) or flows (igneous).
The main stratigraphic unit is a formation, which according to the ICS, should be established with the following principles in mind:
The contrast in lithology between formations required to justify their establishment varies with the complexity of the geology of a region and the detail needed for geologic mapping and to work out its geologic history. No formation is considered justifiable and useful that cannot be delineated at the scale of geologic mapping practiced in the region. The thickness of formations may range from less than a meter to several thousand meters.
In other words, a formation is a series of beds that is distinct from other beds above and below, and is thick enough to be shown on the geological maps that are widely used within the area in question. In most parts of the world, geological mapping is done at a relatively coarse scale, and so most formations are in the order of a few hundred metres thick. At that thickness, a typical formation would appear on a typical geological map as an area that is at least a few millimetres thick.
A series of formations can be classified together to define a group, which could be as much as a few thousand metres thick, and represents a series of rocks that were deposited within a single basin (or a series of related and adjacent basins) over a few million to a few tens of millions of years.
Often a series of beds or members with some aspect in common will be mapped as a single formation, and two or more formations with some aspect in common might be mapped as a single group. Depending on the purpose of the map, these designations might be made on the basis of the main rock type, a compositional change (often indicated by a change in colour or in metamorphic rocks by the appearance of a new mineral), a textural change (grain size, foliation, change of igneous texture), or a change in the fossil assemblage.
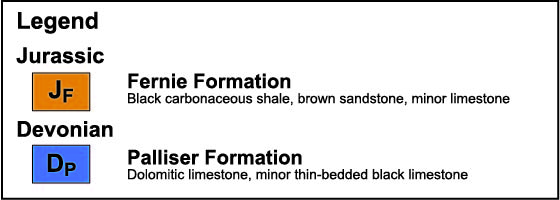
The units on a geological map are defined in the legend. As we learned in Lab 8, the purpose of a legend is to define all symbols, abbreviations or colours used on a map to the reader. For every unit mapped, the legend should state the map code, colour, name, rock types, and age of the unit, as shown in the example in Figure 9.2.2.
The colour refers to the colour of the polygon drawn on the map. The map code is the combination of letters that typically indicate the age (e.g., “J” for Jurassic) and a link to the name of the unit (e.g., “F” for Fernie, “P” for Palliser). The age of the unit is indicated by the most specific name of the eon, era, period or epoch in the geological time scale (e.g., Jurassic, Devonian). A brief description of the different rock types included in each mapped unit is provided for reference. Notice that often several different rock types of similar age are mapped together as a single unit. Legends on a geological map are always formatted such that the oldest unit is at the bottom and the youngest unit is at the top.
Media Attributions
- Figure 9.2.1: Images created using Visible Geology. All rights reserved.
- Figure 9.2.2: © Siobhan McGoldrick. CC BY.
a layer with geographic information that serves as a background, provides context for additional layers or data plotted on the map
In the context of a geological map, this refers to how a rock unit is drawn on the map, or the way a rock unit looks in map view.
The lithostratigraphic unit next higher in rank to formation; a stratigraphically-continuous series of related formations.
A body of rock identified by lithic characteristics and stratigraphic position; it is prevailingly but not necessarily tabular and is mappable at the Earth’s surface or traceable in the subsurface.
A formal lithostratigraphic unit next in rank below a formation and is always a part of some formation. It is named as a member within a formation because it possesses characteristics distinguishing it from adjacent parts of the formation.
The smallest formal lithostratigraphic unit of sedimentary rocks.
the smallest formal lithostratigraphic unit of volcanic rocks. A discrete volcanic rock body distinguishable by texture, composition, order of superposition, paleomagnetism, or other objective criteria.
