
Lab 8: Mapping Fluvial Landscapes
Lab Structure
| Assignment | Yes – submit fluvial features map |
| Recommended additional work | Yes – Practice Exercise 8.3 |
| Required materials | Tracing paper, pencil, pencil crayons, ruler, printed Elbow River Map Area base image |
Learning Objectives
After reading the background information in this chapter, and completing the exercises within it, you should be able to:
- Understand and interpret maps as a geologist.
- Identify erosional and depositional features associated with fluvial environments.
- Describe the evolution of a meandering stream.
- Locate topographic maps within Canada using the National Topographic System (NTS).
- Describe locations using UTM coordinates.
- Understand map scale and how to determine distances on a map.
- Understand how elevation data are presented on a topographic map as contour lines.
- Create a surficial geology map of fluvial features.
Key Terms
|
|
Streams are the most important agents of erosion and transportation of sediments on Earth’s surface. They are responsible for the creation of much of the topography that we see around us. They are also places of great beauty and tranquility, and of course, they provide much of the water that is essential to our existence. But streams are not always peaceful and soothing. During large storms and rapid snowmelts, they can become raging torrents capable of moving cars and houses and destroying roads and bridges. When they spill over their banks, they can flood huge areas, devastating populations and infrastructure. Over the past century, many of the most damaging natural disasters in Canada have been floods, and we can expect them to become even more severe in the near future as the climate changes.
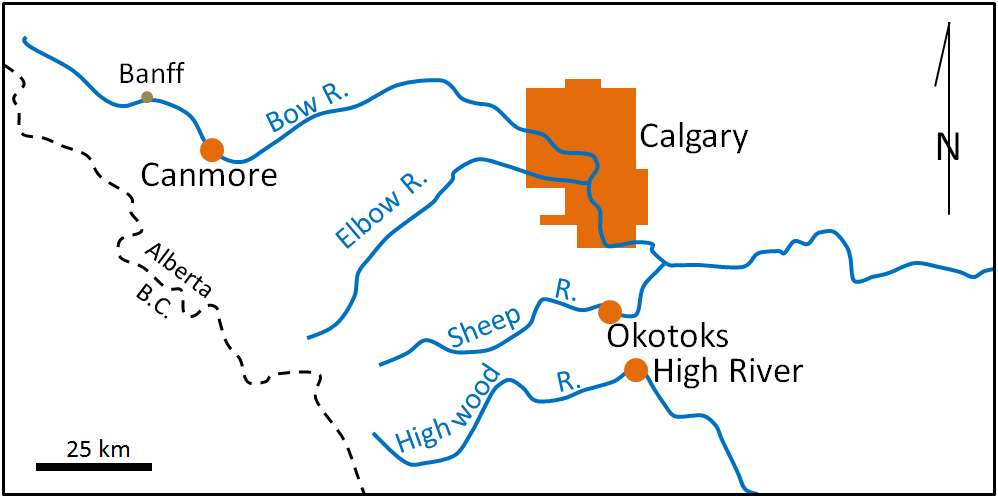
Canada’s most costly flood ever was the June 2013 flood in southern Alberta, affecting the communities of Canmore, Calgary, Okotoks, and High River (Figure 8.0.1). The flooding was initiated by snowmelt and worsened by heavy rains in the Rockies due to an anomalous flow of moist air from the Pacific and the Caribbean. At Canmore, rainfall amounts exceeded 200 millimetres in 36 hours, and at High River, 325 millimetres of rain fell in 48 hours.
In late June and early July, the discharges of several rivers in the area, including the Bow River in Banff, Canmore, and Exshaw, the Bow and Elbow Rivers in Calgary, the Sheep River in Okotoks, and the Highwood River in High River, reached levels that were 5 to 10 times higher than normal for the time of year! Large areas of Calgary, Okotoks, and High River were flooded and five people died. The cost of the 2013 flood is estimated to be approximately $5 billion.
One of the things that the 2013 flood on the Bow River teaches us is that we cannot predict when a flood will occur or how big it will be, so in order to minimize damage and casualties we need to be prepared. Some of the ways of doing that are as follows:
- Mapping flood plains and not building within them
- Building dykes or dams where necessary
- Monitoring the winter snowpack, the weather, and stream discharges
- Creating emergency plans
- Educating the public
Media Attributions
- Figure 8.0.1: © Steven Earle. CC BY.
- Elbow River Map Area satellite image used under the following Google Maps and Google Earth guidelines.
