
2 Red Blood Cell Indices, Colour, and Size
Michelle To and Valentin Villatoro
RBC Indices
Red blood cell indices are useful parameters when investigating suspected anemia. They help provide a general idea of the clinical picture, predict the red blood cell appearance, and aid in the classification of anemia. These indices may be calculated using the red blood cell count, hematocrit, and hemoglobin values generated by automated hematology analyzers, or directly measured in the case of MCV, depending on the model of instrument being used.1,2
1. Mean Cell Volume (MCV)
MCV (fL, 10x-15L) = Hct (L/L) x 1000
RBC Count (x10-12/L)
*Reference range: 80-100 fL
MCV is the measurement of the average red blood cell volume and is used to classify red blood cells based on size 3,4
| <80 fL | Microcytic |
| 80-100 fL | Normocytic |
| >100 fL | Macrocytic |
Note: If the MCV is measured directly, it may be increased if there are many reticulocytes present.3
2. Mean Cell Hemoglobin (MCH)
MCH (pg, 10x-12g) = Hb(g/L)
RBC Count (x10-12/L)
*Reference range: 28-36 pg
MCH is the measurement of the average hemoglobin weight in a red blood cell.3
3. Mean Cell Hemoglobin Concentration (MCHC)
MCHC (g/L) = Hb(g/L)
Hct (L/L)
*Reference range: 310-360 g/L
MCHC is the measurement of the hemoglobin concentration in a population of red blood cells. This is used to denote the colour of the red blood cell population.3,5
| <310 g/L | Hypochromic |
| 310-360 g/L | Normochromic |
| >360 g/L | Check for spherocytes or errors in Hb/Hct measurement (interferences) |
4. Red Blood Cell Distribution Width (RDW)
RDW is the coefficient of variation or standard deviation of the MCV. Similar to the RBC indices, it is determined by automated cell counting instruments and is used to predict the degree of red blood cell size variation, known as anisocytosis.2-4
An increase in the RDW would indicate a higher presence of anisocytosis on the peripheral blood smear.2-4
A decrease in the RDW is not associated with any known abnormalities.2-4
*Reference range: 11.5-14.5%
*Please be aware that the reference ranges provided in this book were obtained from multiple sources and may not accurately reflect the values used in your laboratory. References ranges vary depending on institution, patient population, methodology and instrumentation. Laboratories should establish their own ranges based on these factors for their own use.
Size
As previously described, MCV is used to classify red blood cells based on their size.
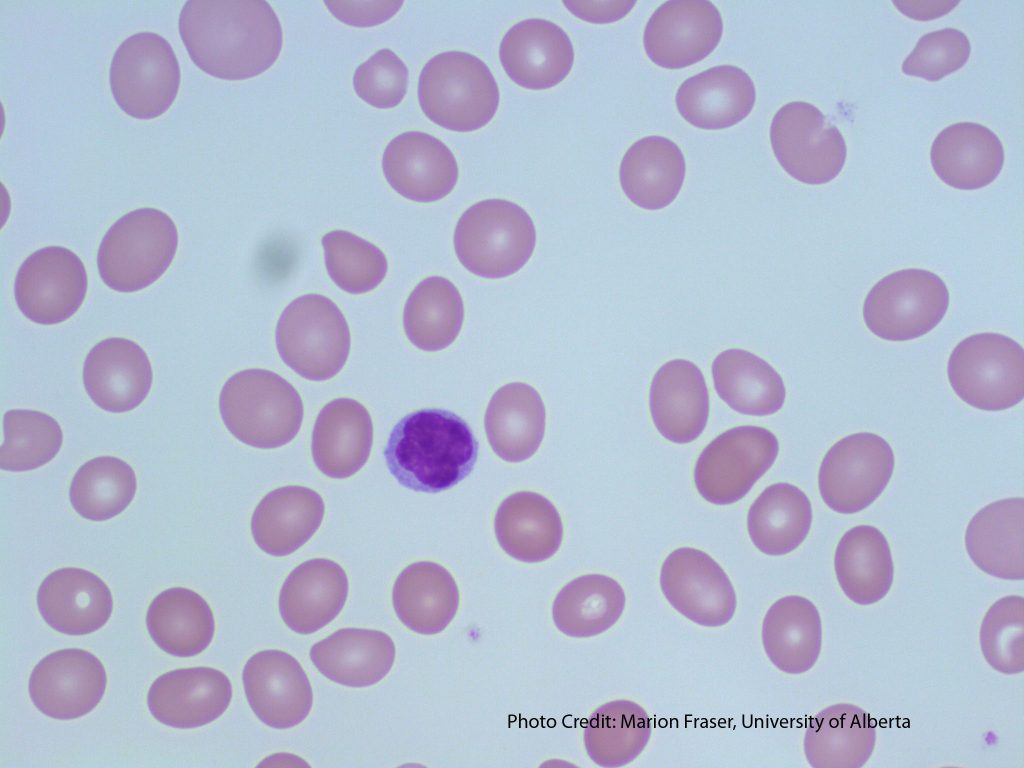
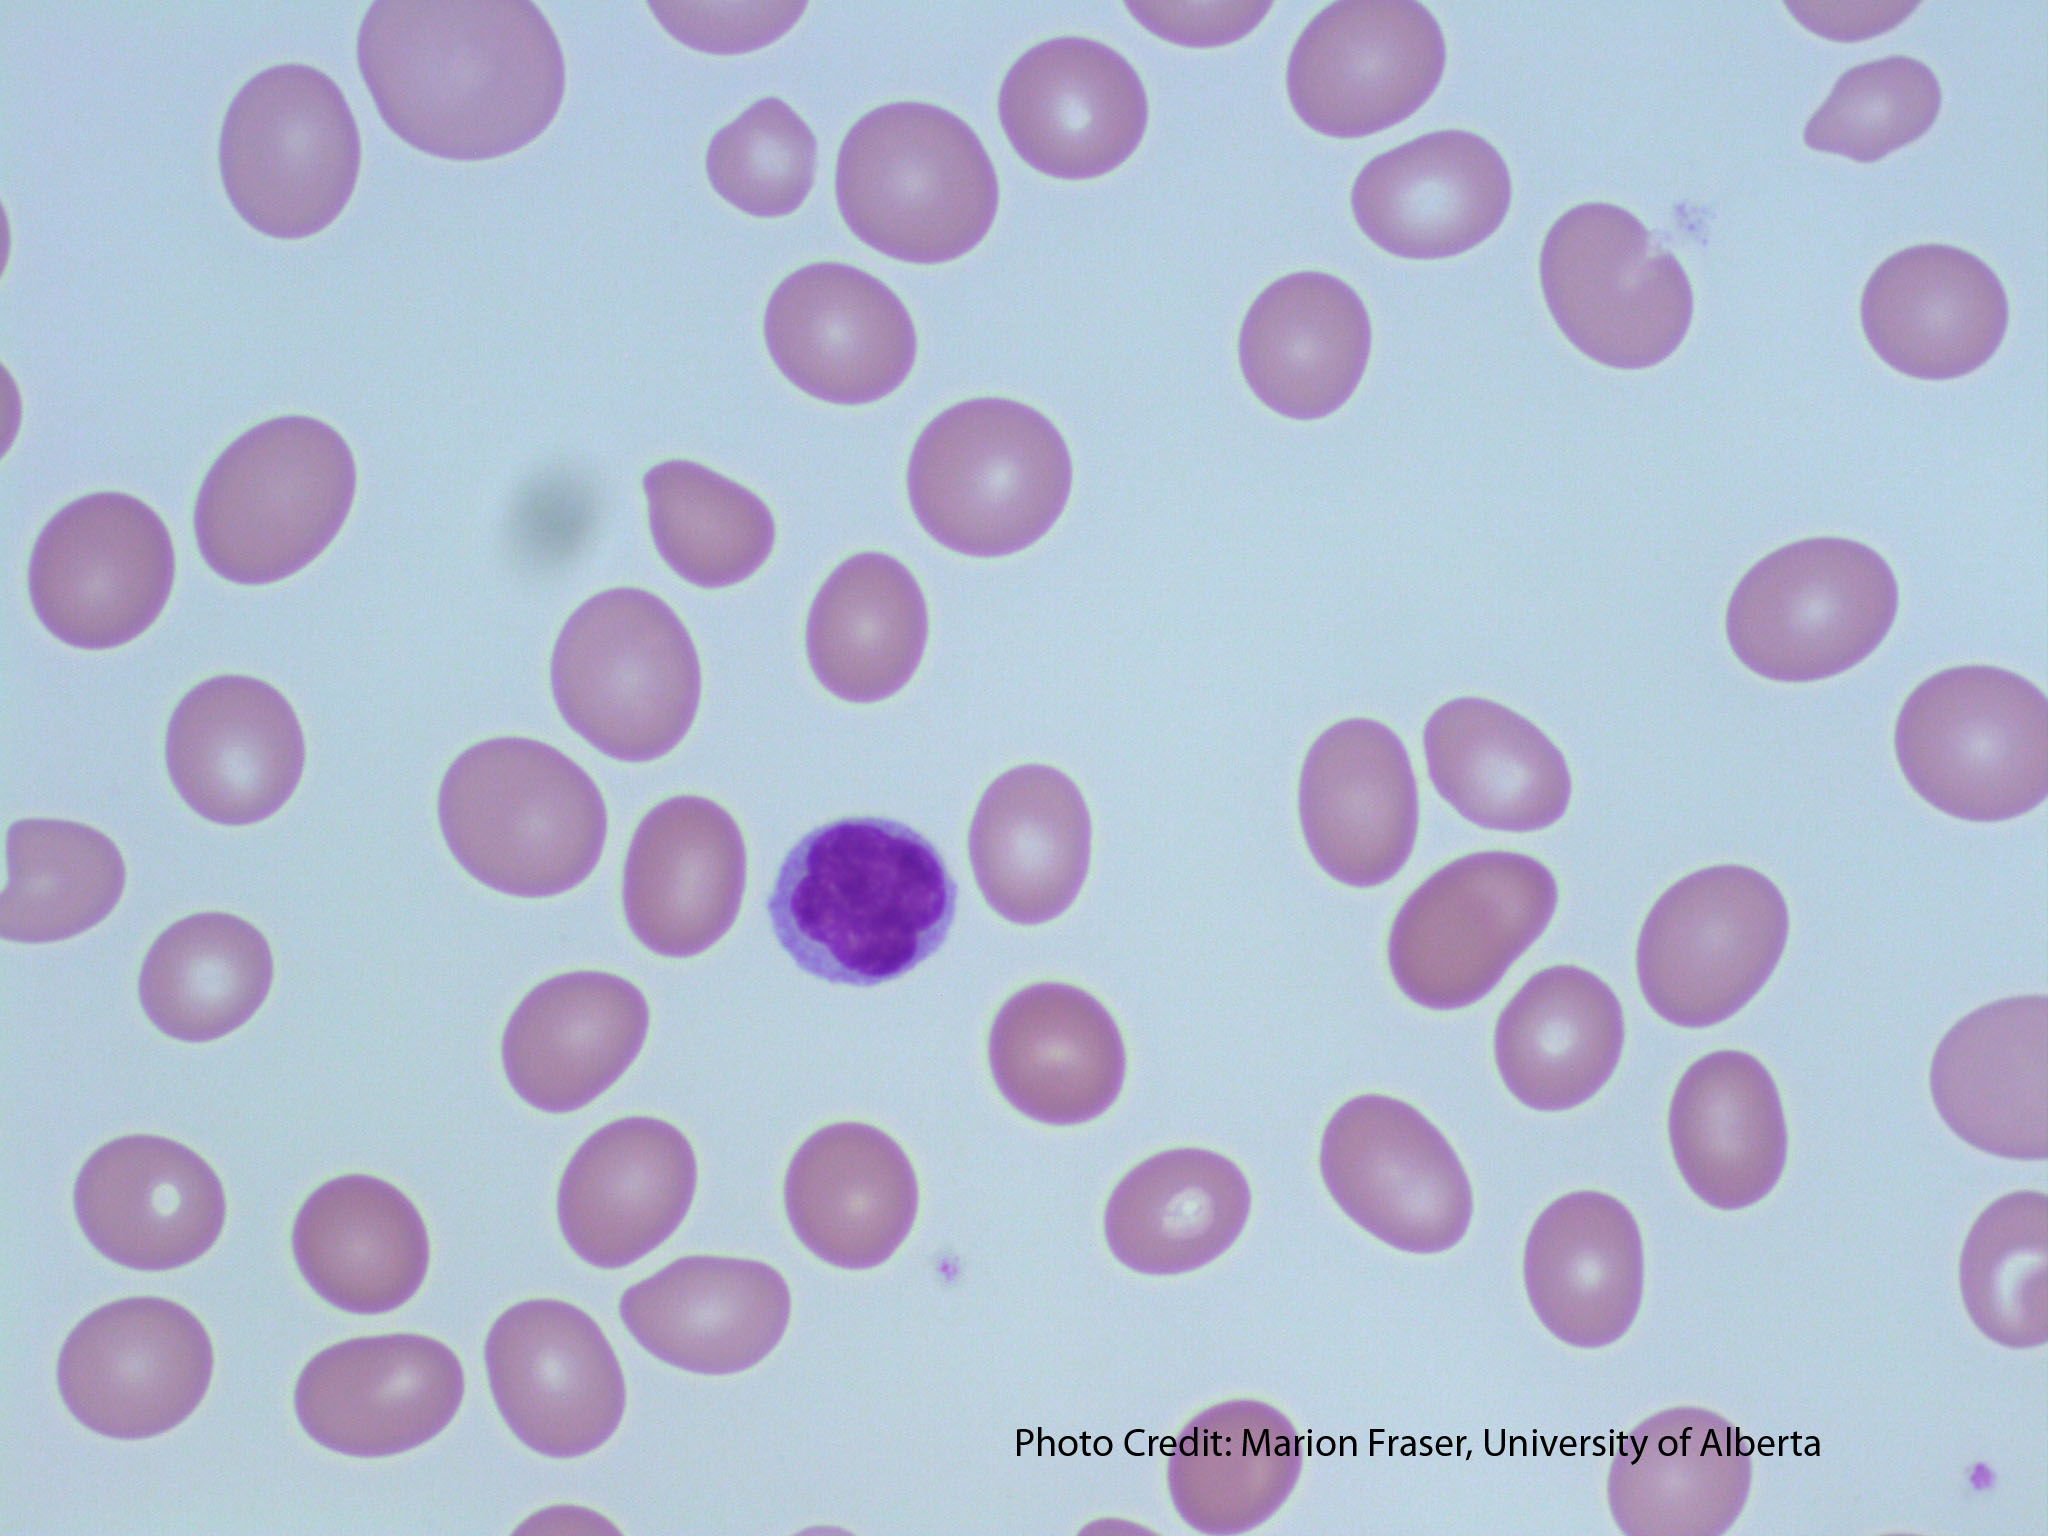
1. Normocytic RBCs
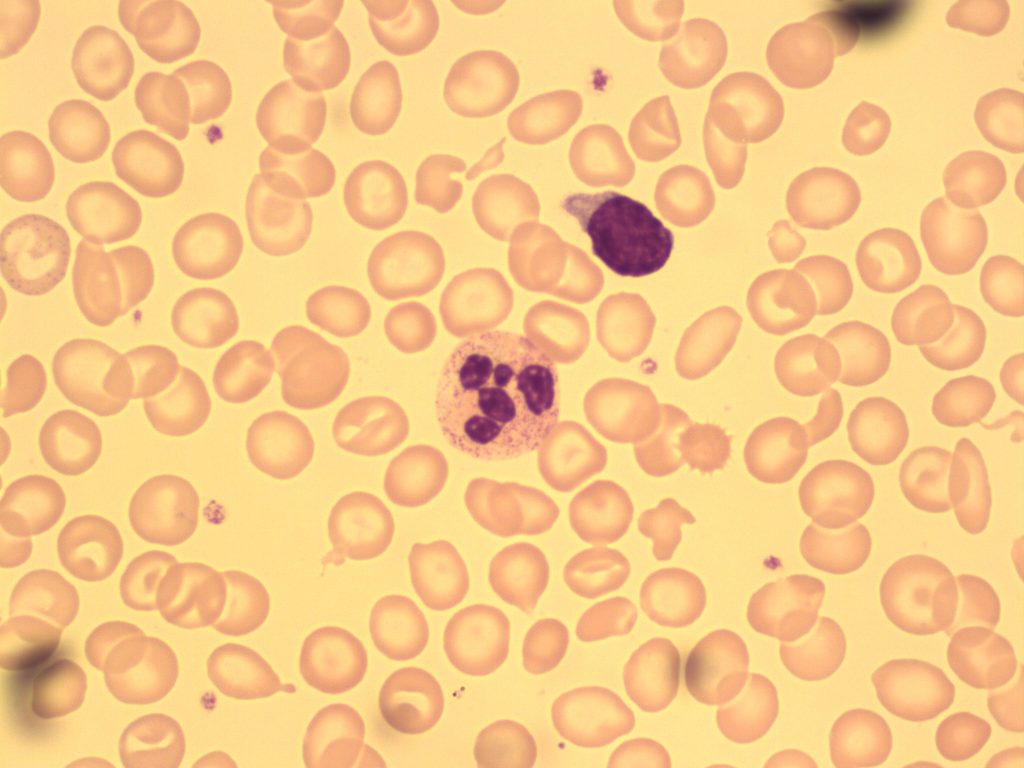
Peripheral blood smears showing normochromic, normocytic red blood cells. From MLS Collection, University of Alberta.
Image 1: 100x oil immersion. https://doi.org/10.7939/R3RJ4995W
Image 2: 60x oil immersion. https://doi.org/10.7939/R35M62P2N
The MCV of normocytic RBCs fall within the normal reference ranges of 80-100 fL and the size should be around 7-8µm.6,7
Size comparison:Mature red blood cells are about the size of the nucleus of a small lymphocyte. It i also approximately three normal red blood cells should fit within a normal neutrophil. 6
2. Microcytic RBCs
Peripheral blood smear images show numerous microcytic red blood cells. A small lymphocyte is present and can be used for a size comparison. From MLS Collection, University of Alberta.
Image 1: 50x oil immersion. https://doi.org/10.7939/R3599ZH07
Image 2: 100x oil immersion. https://doi.org/10.7939/R3WS8J199
A microcytic red blood cell measures less than 7-8µm, and has an MCV that is <80 fL. The hemoglobin concentration (MCHC) can be normal or decreased, and can help differentiate different clinical conditions or severities of anemia.
Microcytes are commonly seen with any abnormalities involving hemoglobin synthesis and thus cells often also appear hypochromic. 3,6,7
Size comparison: Microcytes are smaller than the size of the nucleus of a normal small lymphocyte. If a normal neutrophil is being used for comparison, more than three microcytes can easily fit in a normal neutrophil.
Associated Disease/Clinical States 7,8:
TAILS:
Thalassemias
Anemia of chronic inflammation
Iron Deficiency Anemia
Lead poisoning
Sideroblastic Anemia
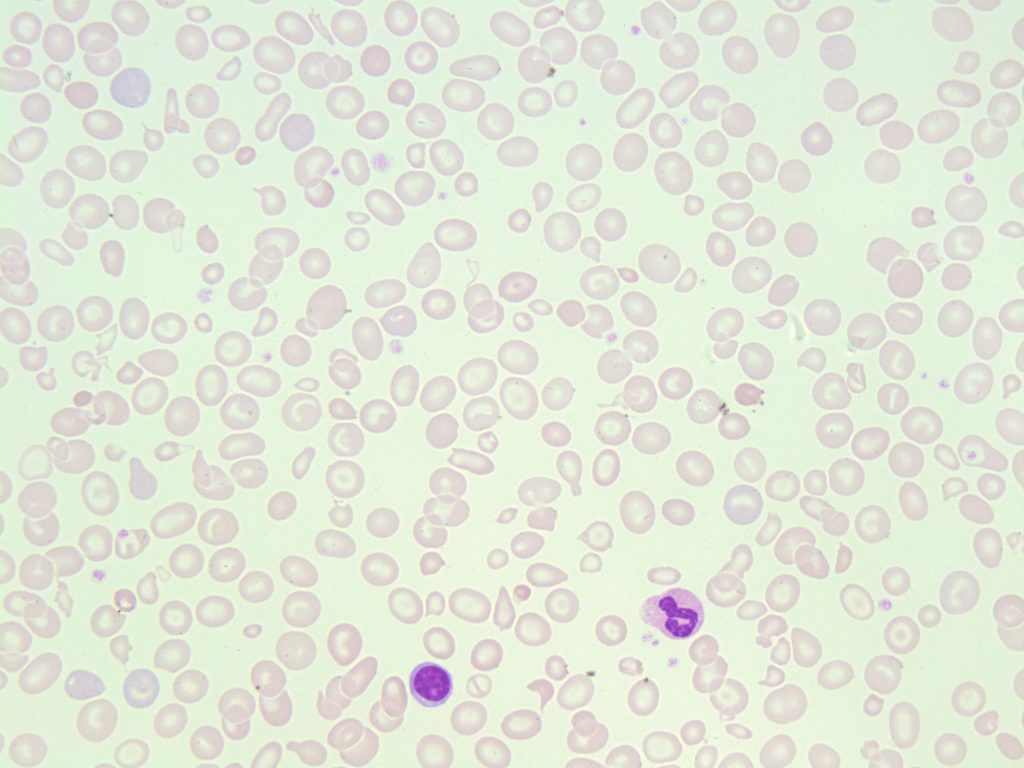
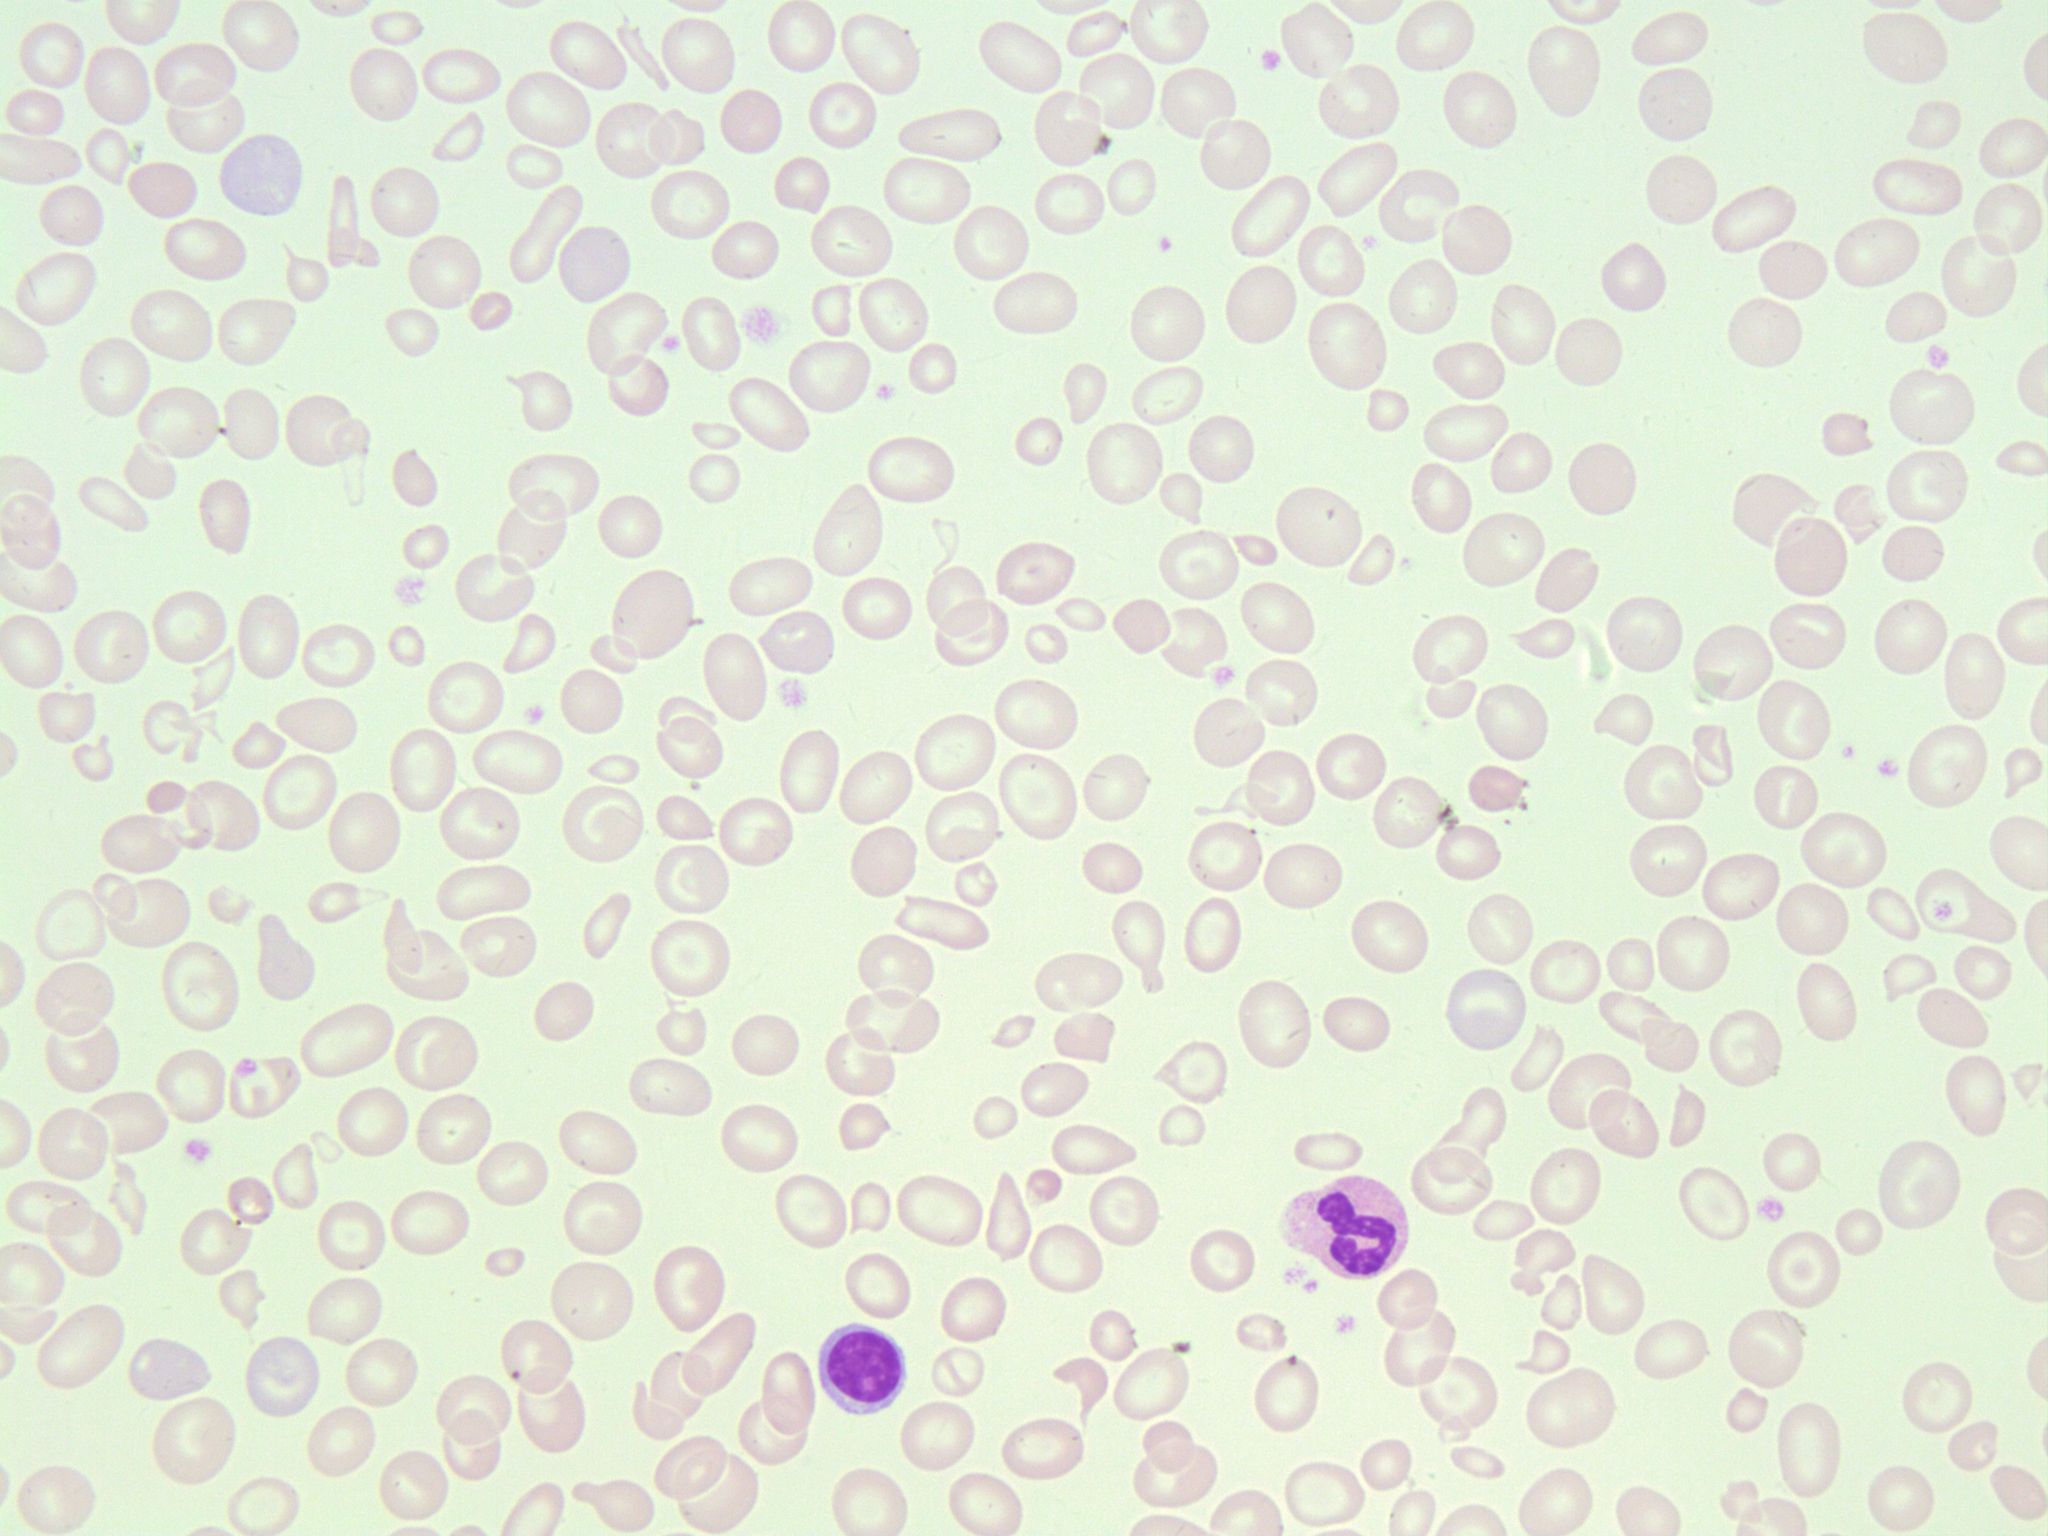
3. Macrocytic RBCs (Round/Oval)
-
- Image shows the presence of oval macroctyes. A small lymphocyte is present for a size comparison. From MLS Collection, University of Alberta, https://doi.org/10.7939/R32J68K7K
-

- A peripheral blood smear containing multiple oval macrocytes. A neutrophil and small lymphocyte are present for size comparison. 100x oil immersion. From MLS Collection, University of Alberta, https://doi.org/10.7939/R3T14V49N
-
- An image taken from a peripheral blood smear with round macrocytes present. A neutrophil is present for a size comparison. 50x oil immersion. From MLS Collection, University of Alberta, https://doi.org/10.7939/R3W08WX8P

-
- An image from a peripheral blood smear containing macrocytes and poikilocytosis. 100x oil immersion. From MLS Collection, University of Alberta, https://doi.org/10.7939/R33R0Q86J

Red blood cells that are ⪰9µm in diameter and have an MCV that is >100 fL are considered macrocytic. Macrocytes can appear as either round or oval, which can help differentiate the underlying abnormality or disease that may be present.3,6,7
|
Shape |
MCV |
Associated Disease/Clinical State(s) 7 |
|
Oval Macrocytes |
Usually >110 fL |
Megaloblastic Anemia (Impaired DNA Synthesis) |
|
Round Macrocytes |
100-110 fL |
Non-megaloblastic Anemias (stimulated erythropoiesis) Liver Disease Myelodysplastic Syndromes (MDS) |
Size comparison: Macrocytes are larger than normal small lymphocytes. The RBCs are large, therefore you cannot fit three within a single normal neutrophil.
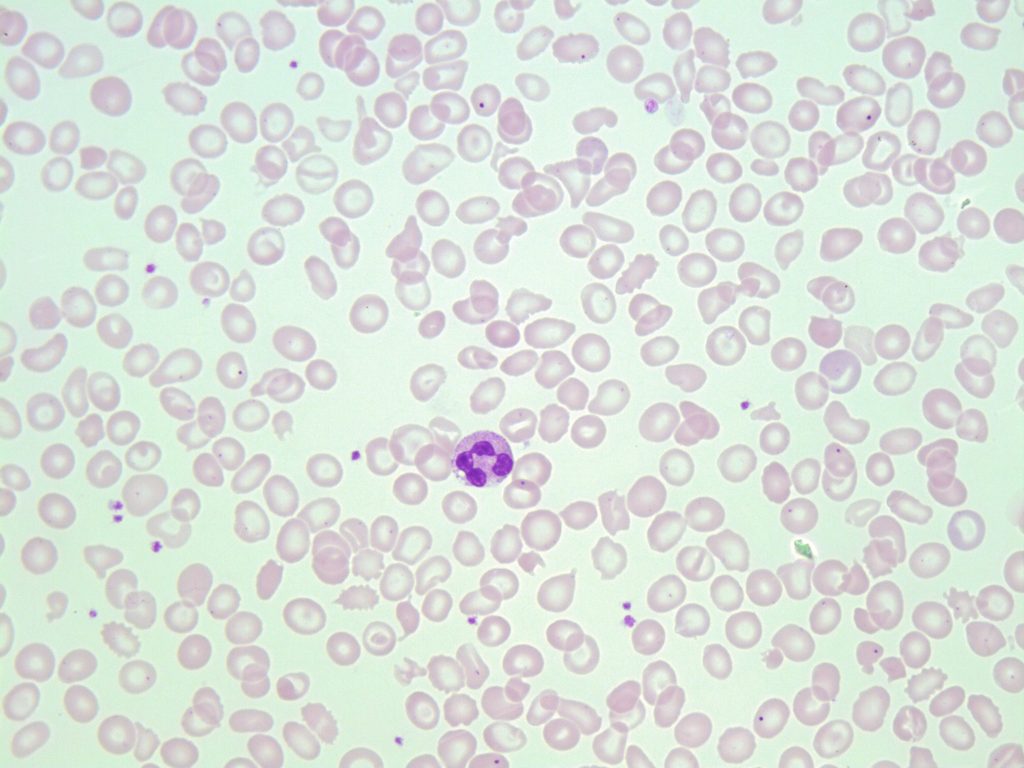
4. Anisocytosis
Images of peripheral blood smears showing anisocytosis (microcytes and normocytes are present). From MLS Collection, University of Alberta.
Image 1: 50x oil immersion. https://doi.org/10.7939/R3Q81574N
Image 2: 100x oil immersion. https://doi.org/10.7939/R3ZS2KV2F
Anisocytosis is a term used to describe variation in red blood cell size in a peripheral blood smear. The degree of anisocytosis should correlate with the Red Blood Cell Distribution Width (RDW).7
Note: If there is a wide variation of cell sizes present (microcytes and macrocytes), the MCV may appear normal as it represents the average cell volume.3
Colour
As previously discussed, MCHC can be used to determine the “colour” of the red blood cell population based on the average hemoglobin concentration.3
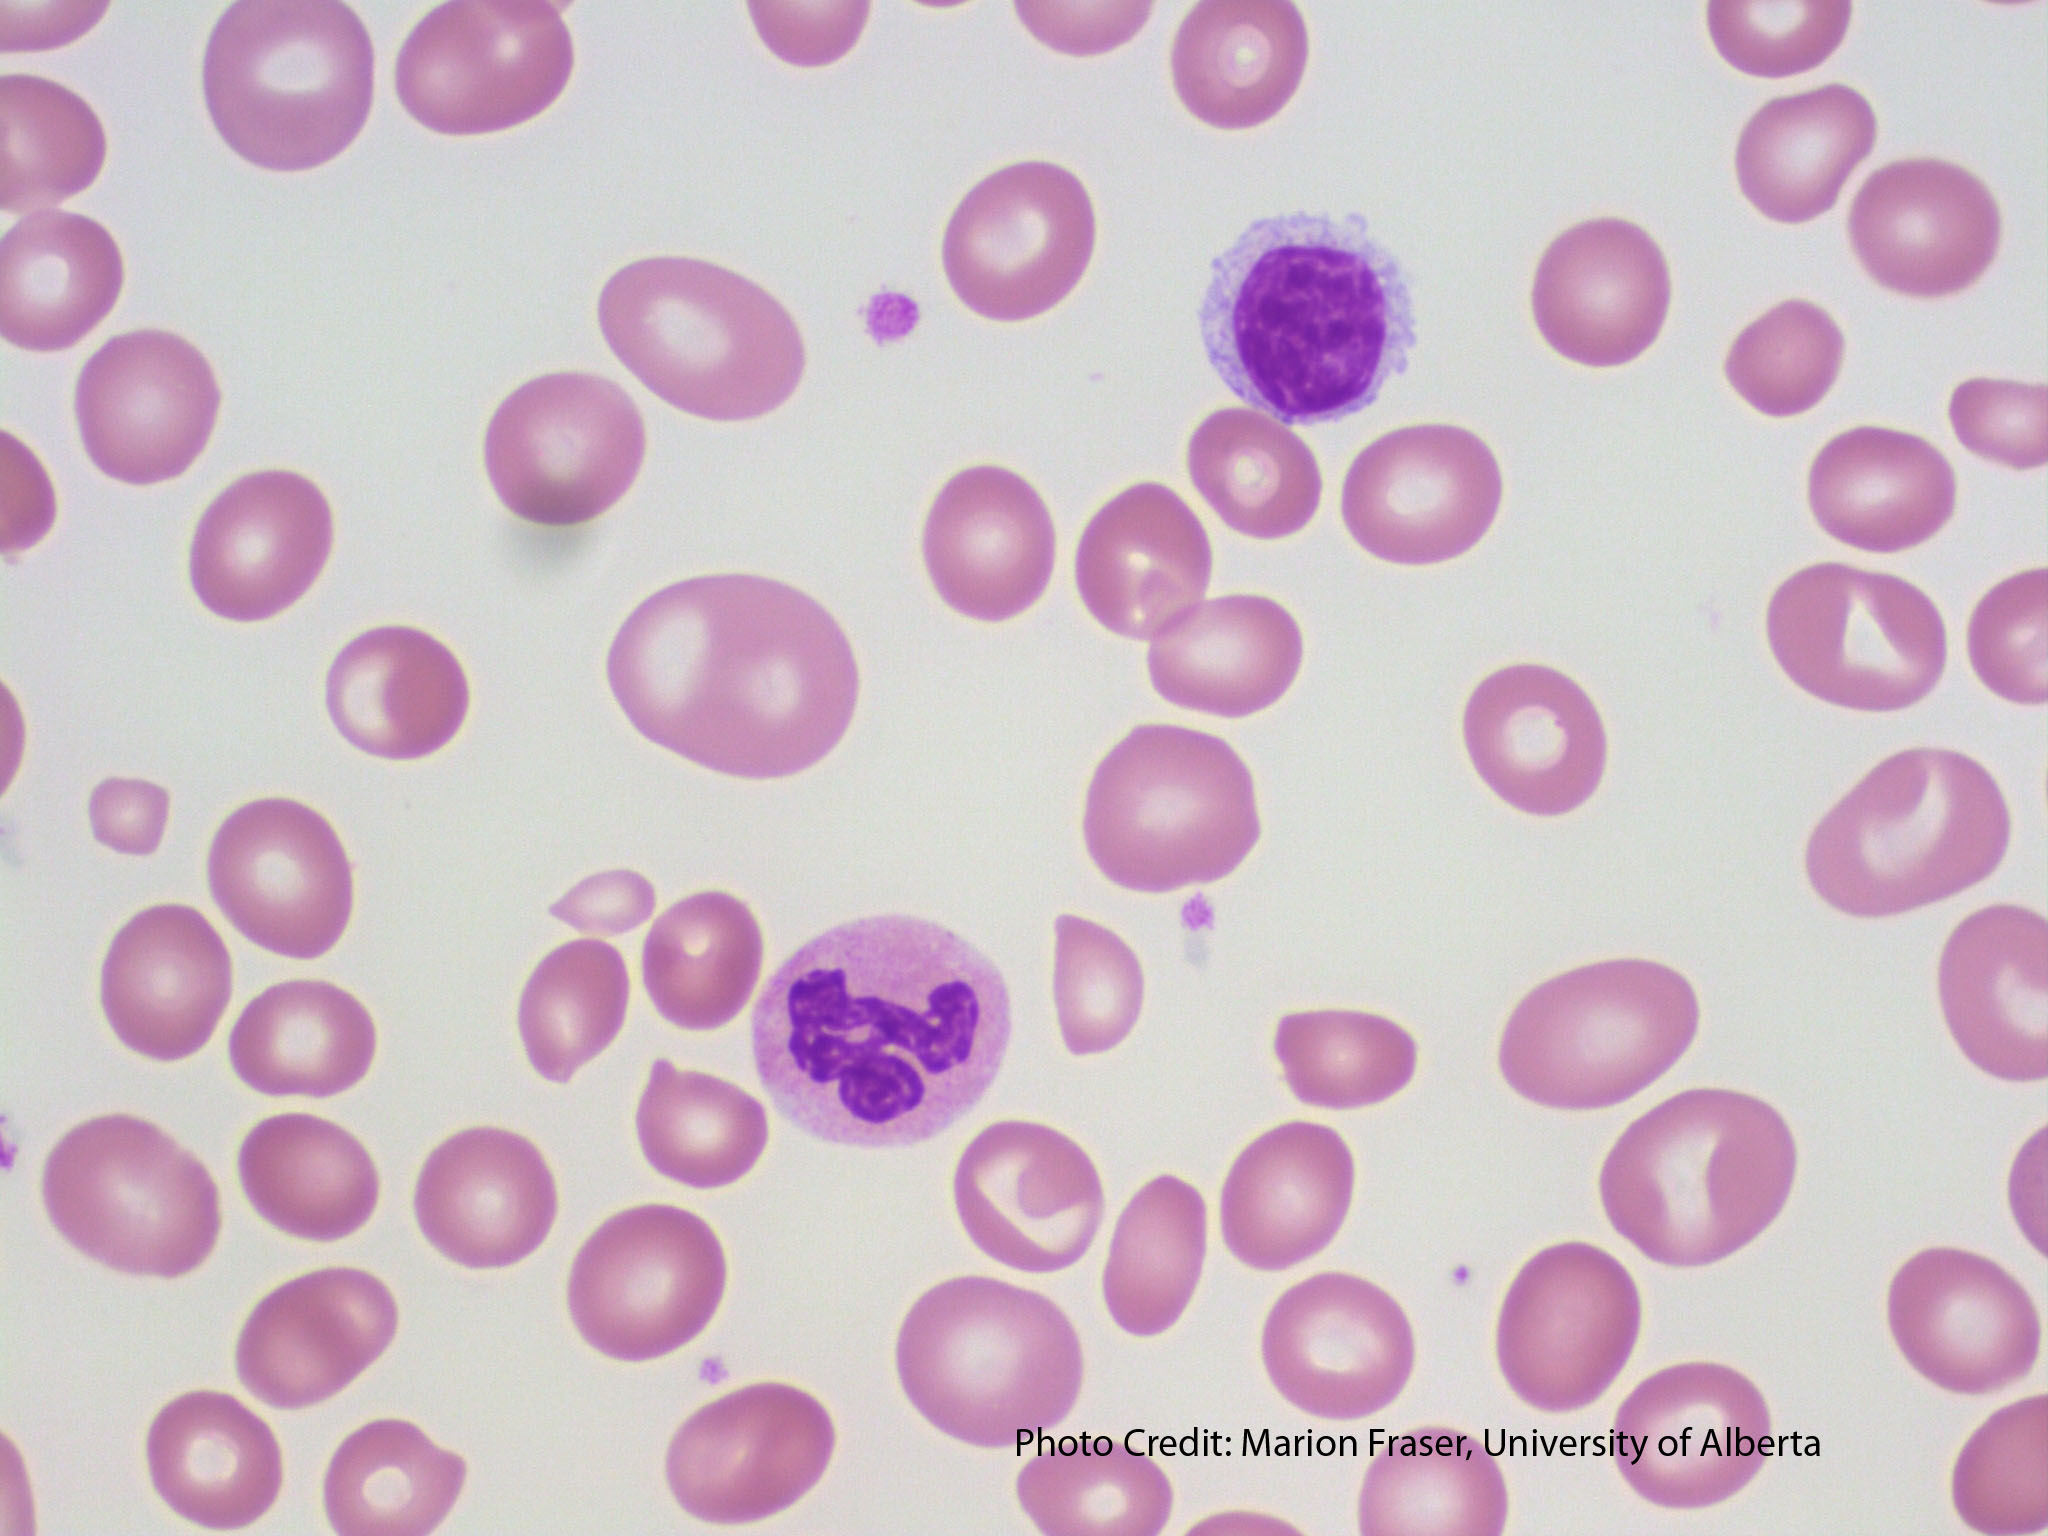
1. Normal (Normochromic) Red Blood Cells
An image from a peripheral blood smear showing normochromic, normocytic red blood cells. 50x oil immersion. From MLS Collection, University of Alberta.
Image 1: https://doi.org/10.7939/R3H12VP79
Image 2: https://doi.org/10.7939/R3MS3KH27
Red blood cells appear normal with an area of central pallor spanning approximately one-third of the diameter of the cell. MCHC and MCH are within normal ranges and cells are referred to as being “Normochromic”.7
MCHC: 310-360 g/L
2. Hypochromic Cells
A peripheral blood smear demonstrating hypochromic red blood cells. From MLS Collection, University of Alberta.
Image 1: 50x oil immersion. https://doi.org/10.7939/R3XS5JX94
Image 2: 100x oil immersion. https://doi.org/10.7939/R3930P92Z
Image 3: 50x oil immersion. https://doi.org/10.7939/R3JH3DH6Q
Red blood cells have an area of central pallor that is greater than one-third of the diameter of the cell.6 The enlarged area of central pallor is due to a lack of hemoglobin content as a result of decreased hemoglobin synthesis.3,4
The MCHC is the most appropriate RBC index to use when determining hypochromia, as the MCH is not as specific.3,4
Hypochromia is often seen with microcytosis and thus have similar associated clinical and disease states.6
MCHC: <310 g/L.
Associated Disease/Clinical States 6:
TAILS:
Thalassemias
Anemia of chronic inflammation
Iron Deficiency Anemia
Lead poisoning
Sideroblastic Anemia
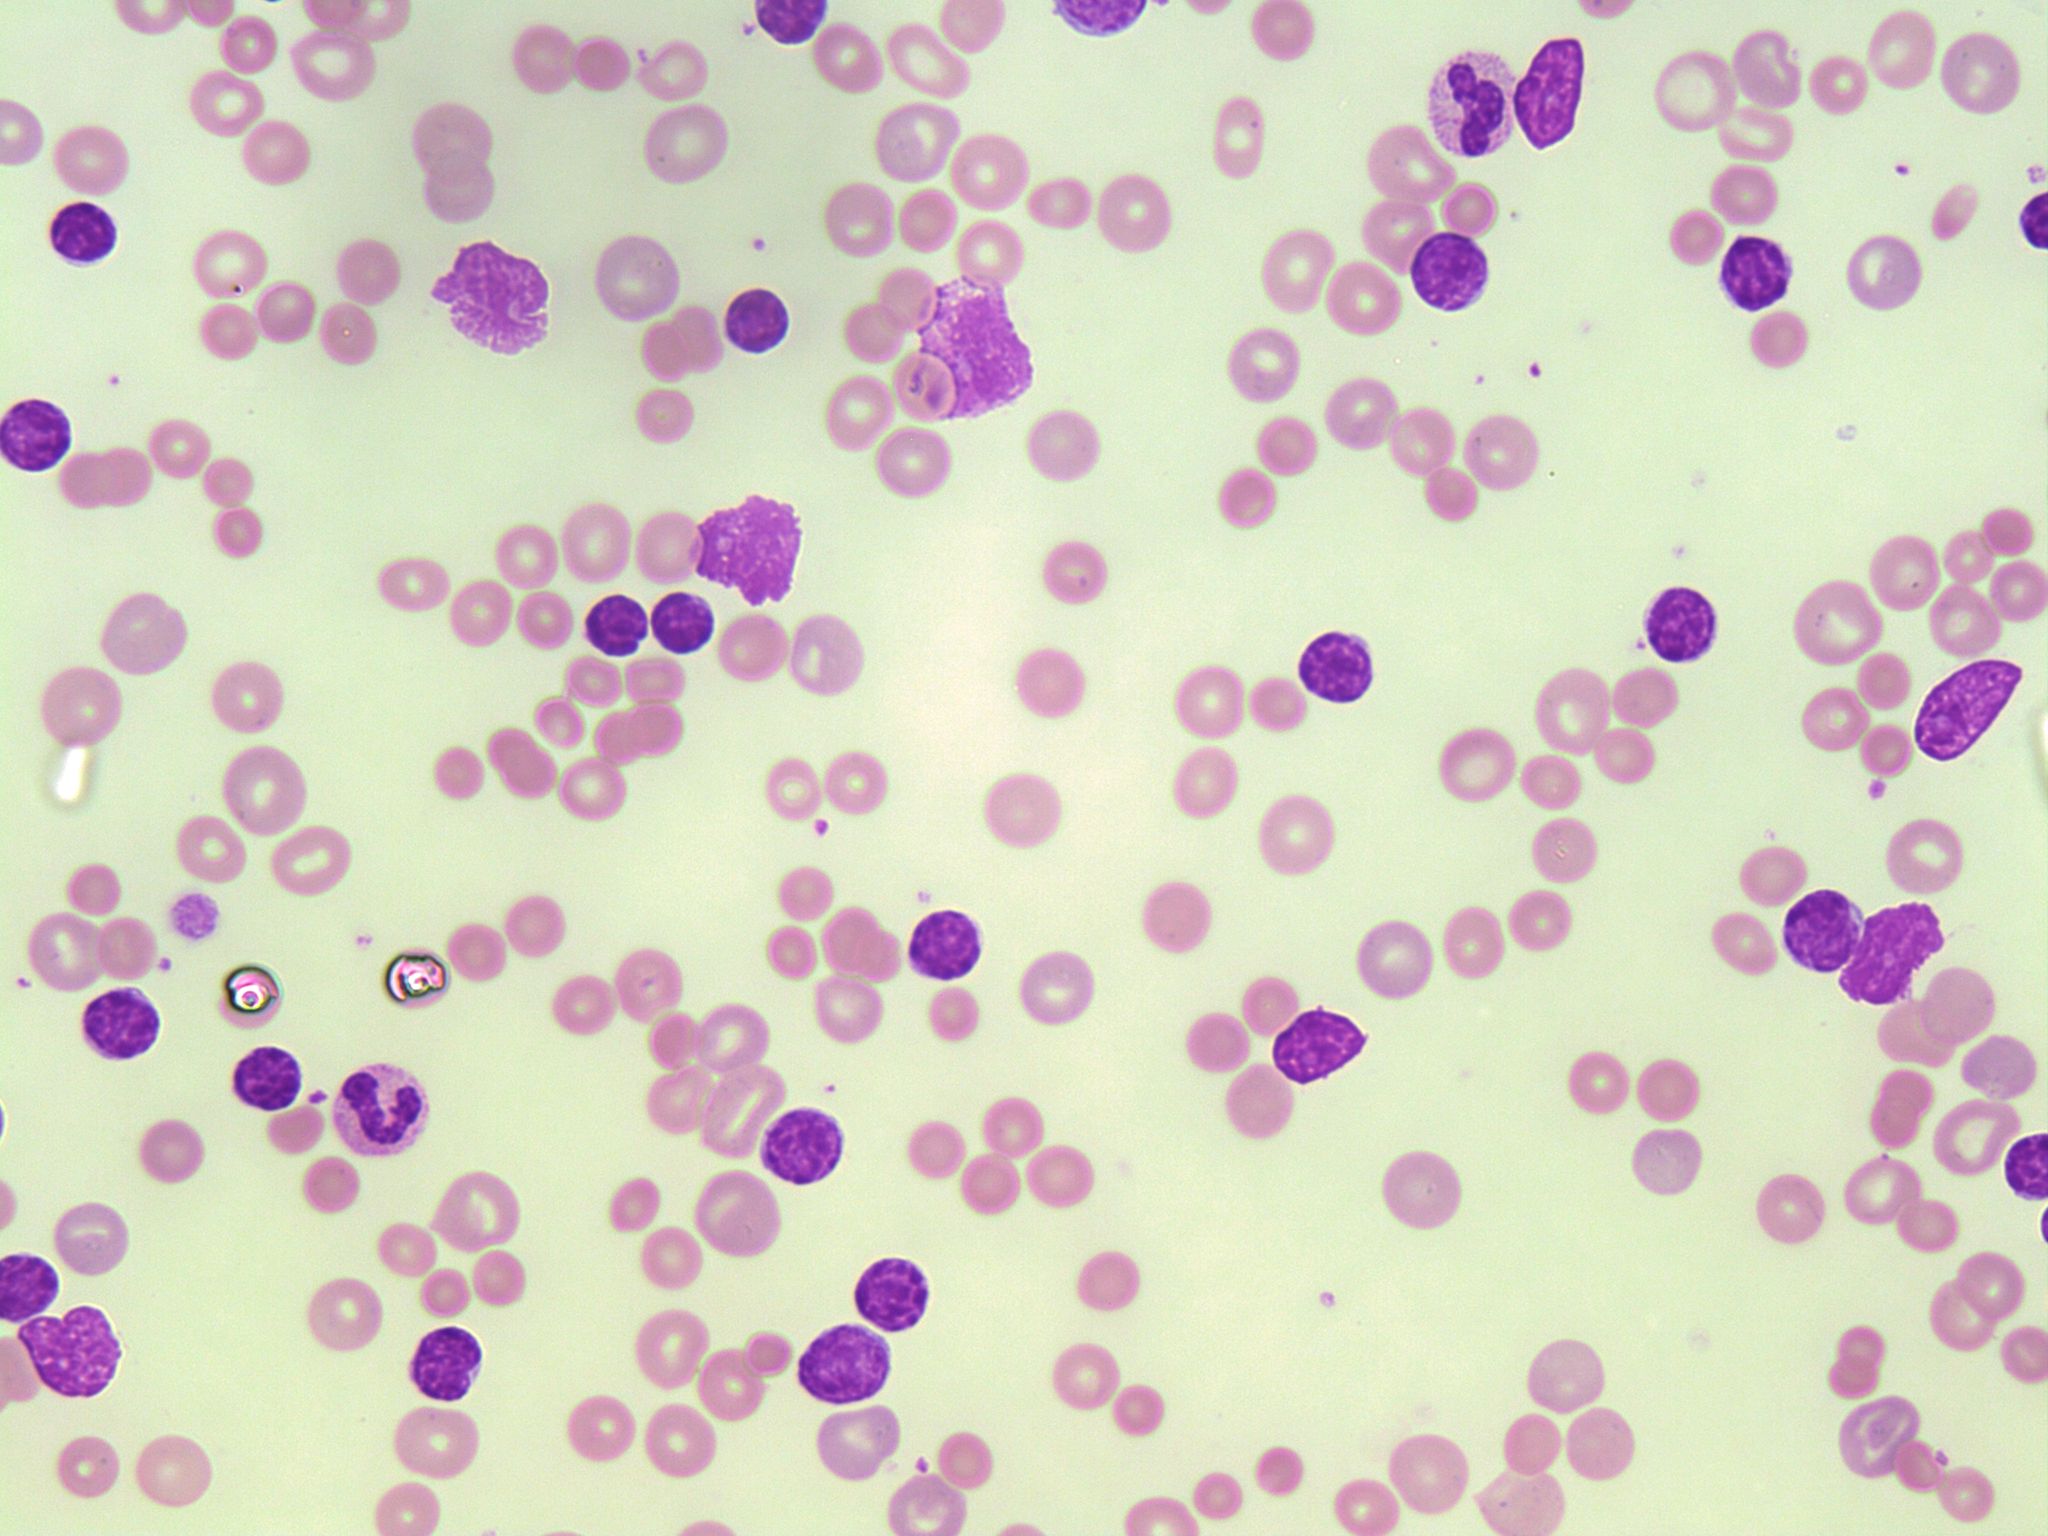
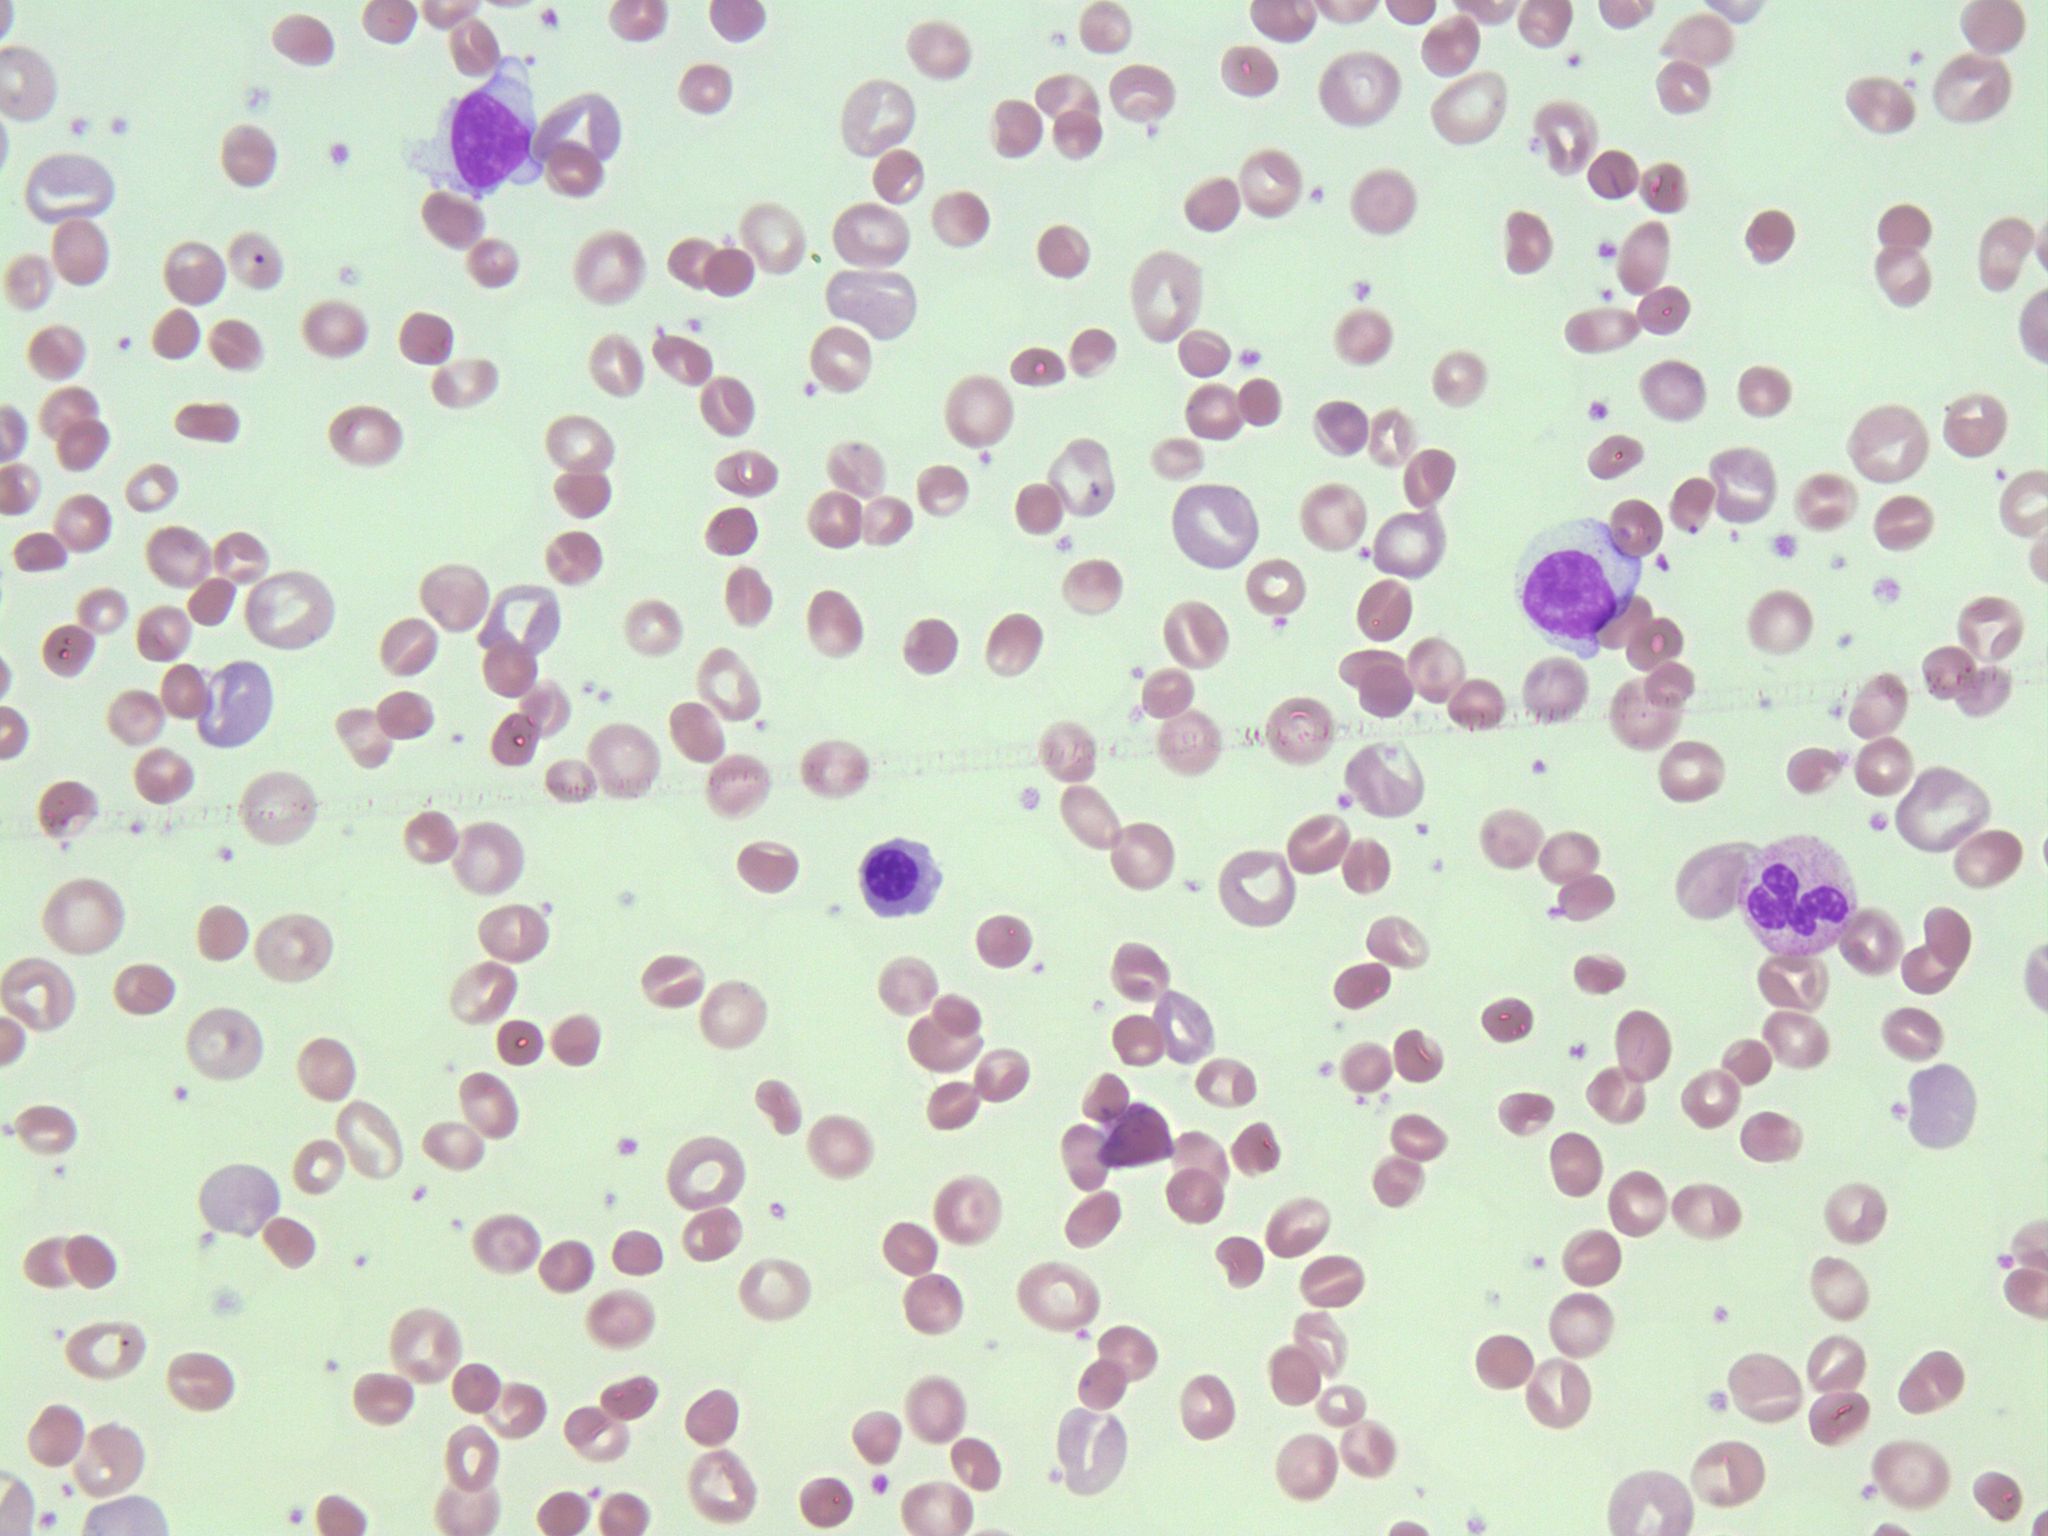
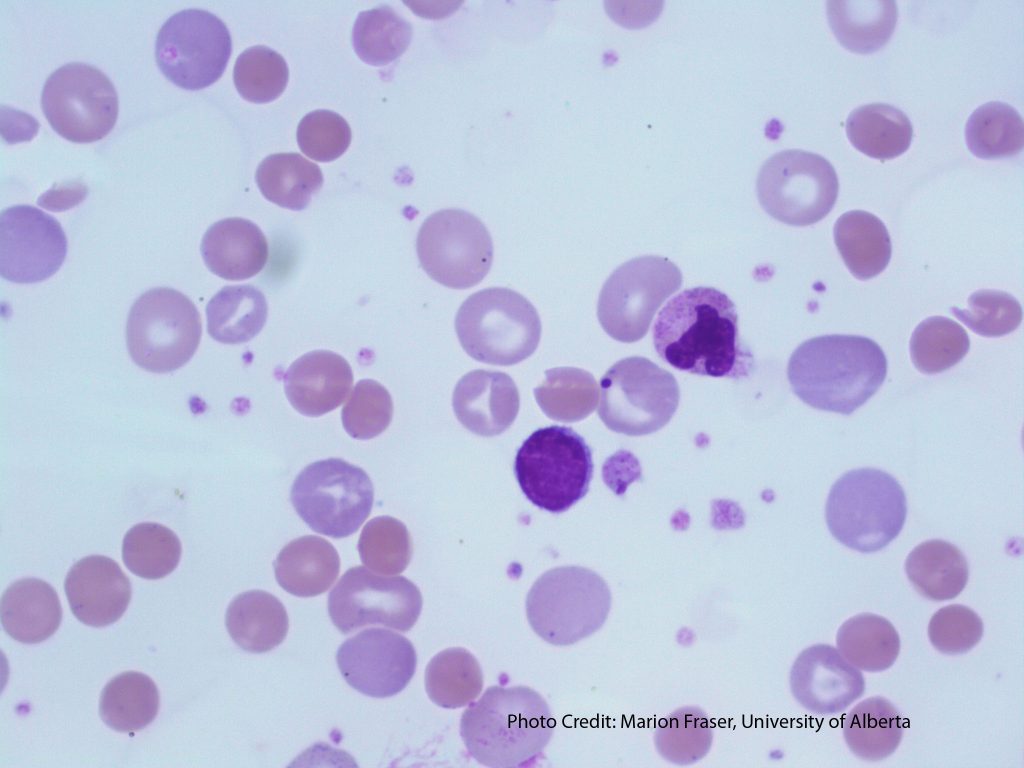
3. Polychromasia
-
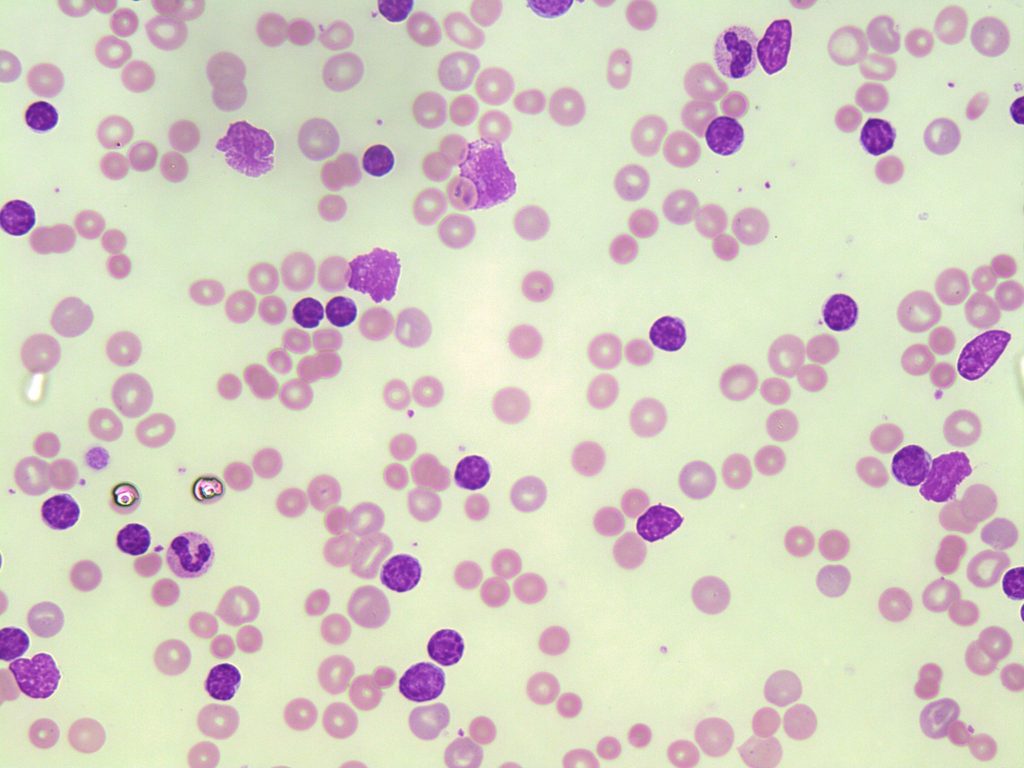
- A image of a CLL peripheral blood smear showing polychromasia in numerous red blood cells. The polychromasia represents reticulocytes. 50x oil immersion. From MLS Collection, University of Alberta, https://doi.org/10.7939/R3513VB2P
-
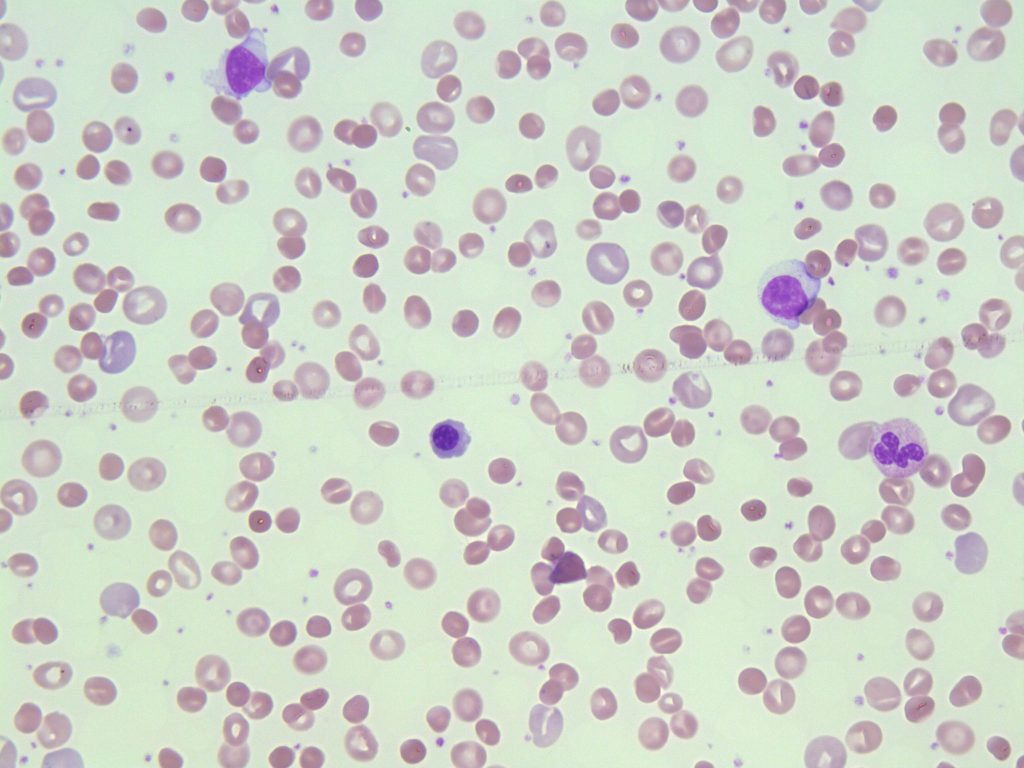
- A peripheral blood smear image representing hereditary spherocytosis. Marked polychromasia is present representing increased amounts of reticulocytes. 50x oil immersion. From MLS Collection, University of Alberta, https://doi.org/10.7939/R3N873F1Q
-
- A peripheral blood smear demonstrating increased polychromasisa (Stained pale blue-purple). From MLS Collection, University of Alberta, https://doi.org/10.7939/R3DZ03H3N

-
- A peripheral blood smear showing a some polychromasia. 50x oil immersion. From MLS Collection, University of Alberta, https://doi.org/10.7939/R3CN6ZF3Z
The appearance of increased polychromasia on a peripheral blood smear is associated with increased red blood cell production and an increased reticulocyte count. Polychromatic cells are larger than mature red blood cells and have a blue-gray color due to the presence of residual RNA in immature red blood cells.3,9
Polychromatic cells are referred to as a “reticulocyte” when the cells are stained with a supravital stain such as New Methylene Blue. The supravital stain precipitates residual RNA, causing reticulocytes to have inclusions of linear chains of granulation (reticulum).7,9
Associated Disease/Clinical States:6
Hemorrhage
Hemolysis
Neonates
References:
1. Glassman AB. Anemia, diagnosis and clinical considerations. In: Clinical hematology and fundamentals of hemostasis. 5th ed. Philadelphia: F.A. Davis Company; 2009. p. 82-92.
2. Hughes VC. Hematology methods. In: Clinical hematology and fundamentals of hemostasis. 5th ed. Philadelphia: F.A. Davis Company; 2009. p. 759-792.
3. Landis-Piwowar K, Landis J, Keila P. The complete blood count and peripheral blood smear evaluation. In: Clinical laboratory hematology. 3rd ed. New Jersey: Pearson; 2015. p. 154-77.
4. Maedel LB, Doig K. Examination of the peripheral blood film and correlation with the complete blood count. In: Rodak’s hematology clinical applications and principles. 5th ed. St. Louis, Missouri; 2015. p. 235-52.
5. Clark KS, Hippel TC. Manual, semiautomated, and point-of-care testing in hematology. In: Rodak’s hematology clinical applications and principles. 5th ed. St. Louis, Missouri: Saunders; 2015. p. 187-234).
6. Rodak BF, Carr JH. Variations in size and colour of erythrocytes. In: Clinical hematology atlas. 5th ed. St. Louis, Missouri: Elsevier Inc.; 2017. p. 89-92.
7. Jones KW. Evaluation of cell morphology and introduction to platelet and white blood cell morphology. In: Clinical hematology and fundamentals of hemostasis. 5th ed. Philadelphia: F.A. Davis Company; 2009. p. 93-116.
8. Ford J. Red blood cell morphology. Int J Lab Hematol [Internet]. 2013 Mar 9 [cited 2018 Jul 12];35(3):351–7. Available from: https://doi.org/10.1111/ijlh.12082
9. Turgeon ML. Erythrocyte morphology and inclusions. In: Clinical hematology: theory and procedures. 4th ed. Philadelphia, PA: Lippincott Williams & Wilkins; 1999. p. 99-111.
