
Hockey stick curve
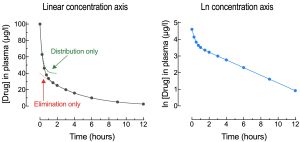
When plasma concentration versus time data for a drug that exhibits two compartment kinetics are plotted on a logarithmic concentration axis (Y-axis), the curve gives the appearance of a hockey stick. The curved blade of the hockey stick is the portion of the curve where exponential distribution and exponential elimination (both first-order processes) are occurring simultaneously. In other words, drug is leaving the plasma as a result of two first-order processes occurring at the same time. When distribution reaches equilibrium then there is only a net loss of drug from the plasma due to first-order elimination, and this would then show up on a logarithmic concentration axis as a straight line (i.e. the handle of the hockey stick).
It is possible to separate out the distribution and elimination portions of the curve by the method of residuals, a curve-stripping procedure; it is necessary to do this in order to determine the A-intercept, and thus the A+B intercept, accurately. Extrapolating the straight handle of the hockey stick back to the Y-axis gives the B-intercept, which can be used to calculate the volume of distribution for the drug. Similarly, from the value for the A+B intercept can be calculated the volume of the central compartment.
