
Steady state concentration
When a drug is administered continuously, in a repeated dosing regimen, for a period of time equal to at least five half-lives of elimination, the drug reaches a steady state concentration (Css). You can control the steady state concentration by modifying the dosing rate of the drug. Doubling the dosing rate would be expected to double the steady state concentration, unless the drug displays dose-dependent kinetics. If the drug is being infused IV then the concentration is a true “steady state” as it is not changing.
More usually, the drug is being given by a repeated dosing regimen, so there will be a peak concentration (Cmax) shortly after administering a dose, and a trough concentration (Cmin) immediately before administering the next dose. In those cases, the steady state concentration would be an average concentration that typically lies a little below the midway point between the peak and the trough, indicated by the grey dashed line in the figure below. In this example, the repeated dosing regimen of 100 mg drug administered as a bolus injection every 4 hours has resulted in a steady state concentration of 0.5 mg/litre. This lies below the recommended therapeutic window, between 0.6 and 1.2 mg/litre, indicated by the blue shaded area. It would therefore be necessary to increase the dosing rate to increase the steady-state concentration; in this example, an increase in the dosing rate to 170 mg every 4 hours would achieve a Css of 0.85 mg/litre.
If peaks and troughs lie outside the limits of the therapeutic window, it may also be necessary to modify the size and timing of the repeat doses; smaller doses given at shorter time intervals result in smaller fluctuations between peak and trough concentrations. In the example below, increasing the dose rate to 170 mg every 4 hours, to achieve a suitable Css, would certainly result in peaks and troughs extending beyond the limits of the therapeutic window, and it would be necessary to modify the dose size and interval to correct for this. Details of calculations that would be done are provided in the entry for repeated dosing calculations.
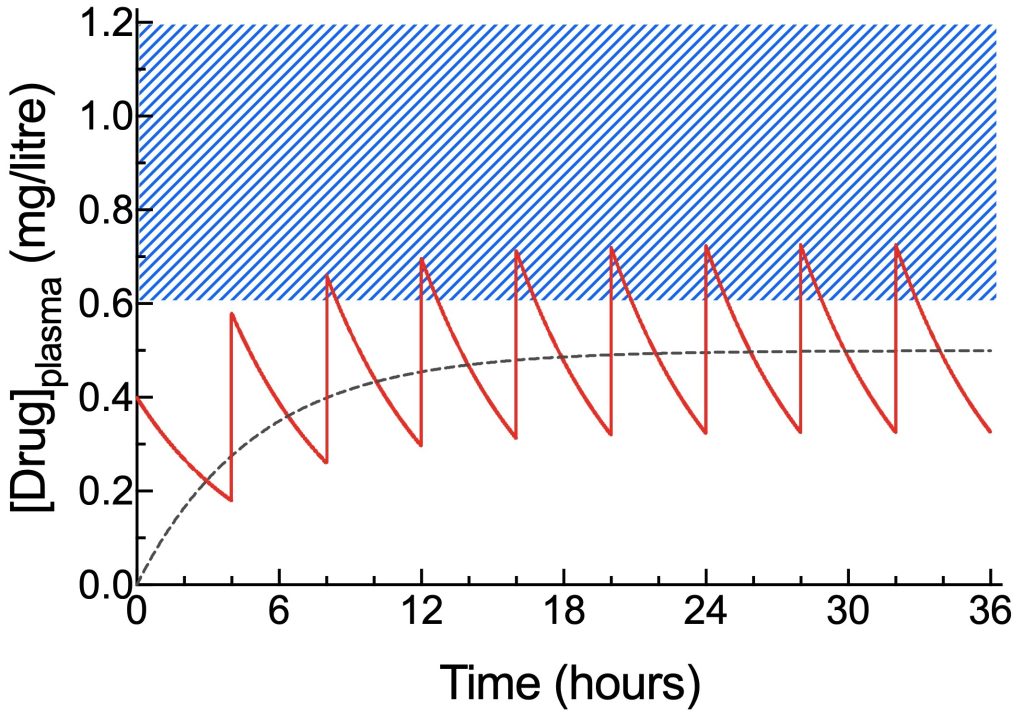
From the elimination rate constant of 0.2/hour, the elimination half life can be calculated to be 0.693/0.2, or 3.5 hours. This is consistent with the time taken to reach Css of almost 18 hours, corresponding to 5 half-lives of elimination. This antibiotic may be a good candidate for administration of a loading dose.
Most drugs have a therapeutic window much wider than in the example shown above. The recommended dosing rate for a drug, listed in the formulary entry for the drug, will, for most patients, result in a Css that lies within the therapeutic window. Patient factors that may result in differences in Css reached in different patients receiving the same dosing rate include age (altered plasma protein binding, altered Clint, altered renal clearance), body size and composition (altered apparent volume of distribution and so altered clearance) and genetic/environmental variations in hepatic enzyme activities.
