
11 Seas and Oceans
This chapter is a near-final draft. It still needs glossary entries, and final editing.
Learning Outcomes
By the end of this section, you should be able to:
- Identify the geographic distribution and the names of Earth’s oceans
- Describe the physical and chemical characteristics of the oceans, and how these characteristics change with depth
- Explain how ocean currents form, and identify the major deep and shallow ocean current systems on Earth
- Explain how tides form, what causes the highest and lowest tides, and what those are called
- Describe wave formation, motion, and how waves change with depth and towards the shore
- Explain how and why global sea level has changed over time and place
- Describe sediment distribution in the oceans
Seas and oceans
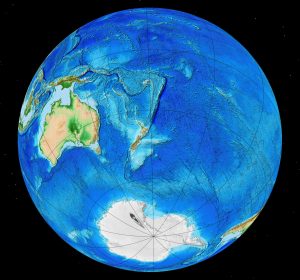
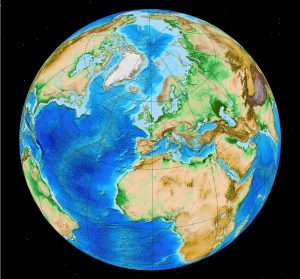
Seawater covers 71% of the Earth’s surface, although it is not evenly distributed. The southern hemisphere (south of the equator) is 81% covered by seawater, whereas only 61% of the northern hemisphere is covered. If the division into hemispheres is not placed at the equator, it’s possible to divide the Earth into a land hemisphere with 46% land, and an ocean hemisphere, with only 12% land.
![]()
![]()
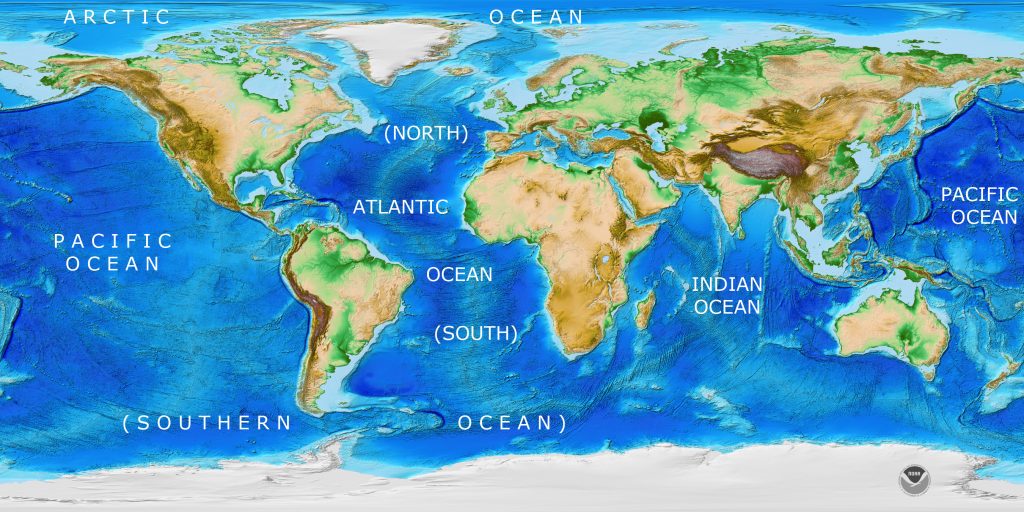
With a few inland exceptions, the Earth’s seas and oceans are all interconnected, so divisions between individual oceans and seas are somewhat arbitrary. Most books recognize four oceans: the Atlantic, Pacific, Indian, and Arctic oceans. Some also recognize a fifth, Southern Ocean. Seas are named where regions are partially separated by islands, but there is no single authority for the naming of seas, so their nomenclature is quite inconsistent.
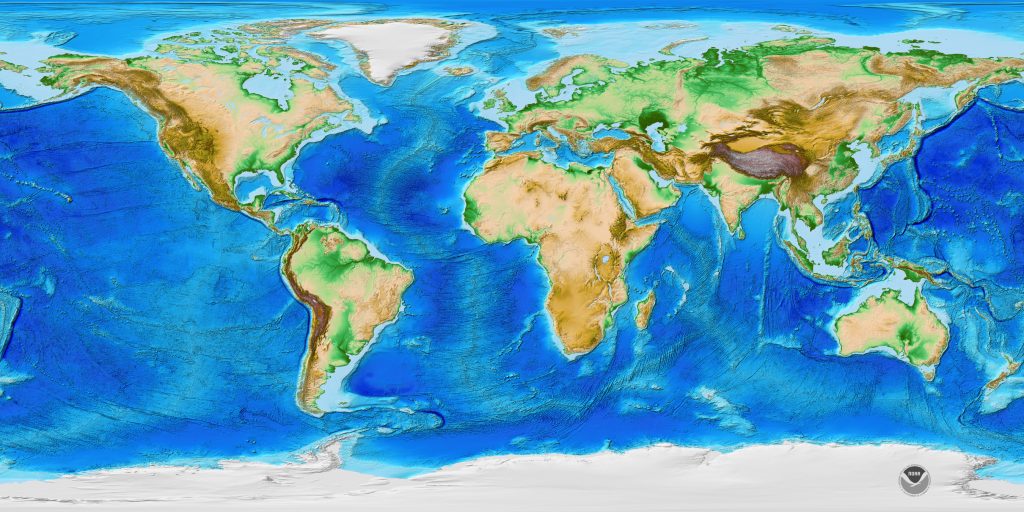
The volume of the oceans is 1.335 x 10⁹ km3, comprising over 97% of the water in the Hydrosphere, but this figure has probably varied somewhat over geological time as the amount of ice on land has gone up and down. The average depth of the seas and oceans is around 4.5 km, but the deepest part of the ocean floor (the Mariana Trench in the west Pacific) is 11 km deep. Maps of the depth of the ocean are called bathymetric maps.
By comparison, large areas adjacent to land, called the continental shelves are extremely shallow, less than 200 m deep. Studies of the Geosphere have shown that the Earth has two fundamentally different types of crust — oceanic and continental — and that the continental shelves are clearly underlain by continental crust. For a geologist, therefore, the continental shelves are part of the continents, that just happen to be flooded with a thin layer of sea-water.
For oceanographers, and especially for marine biologists, the continental shelves are a critically important part of the ocean system, because light can penetrate to the sea-floor in many parts of the continental shelf, making their ecosystems extremely productive and diverse in comparison to deeper, darker parts of the ocean.
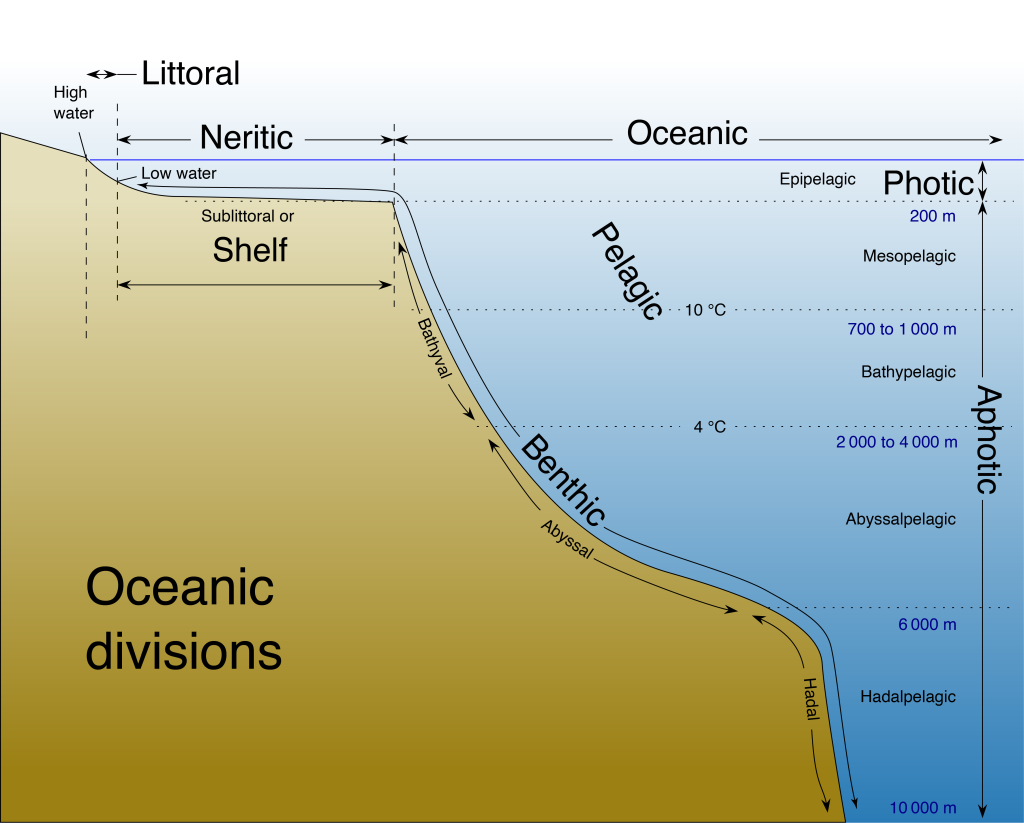
Because of this importance of depth, the oceans and seas are divided into zones, that are of critical importance in the understanding of marine life.
- The littoral zone lies between high and low tide marks, so it is exposed directly to the atmosphere at low tide.
- The sublittoral or neritic zone overlies the continental shelves, having water-depths between 0 and 200 m.
- The oceanic zone lies beyond the shelf edge and is subdivided into the following:
Composition and temperature of ocean water
Salinity
The rivers are constantly delivering dissolved load to the oceans. Whereas the water in the oceans is constantly recycled in the hydrologic cycle via evaporation, the dissolved solids are not, so they gradually accumulate in the oceans, which have significantly higher concentrations of dissolved material than rivers and lakes.
The proportion of dissolved ions in ocean water is called the salinity. By weight, it averages around 3.5%, or 35‰ (parts per thousand), or 35,000 ppm (parts per million). Typical rivers have only about 0.12‰, or 120 ppm salinity.
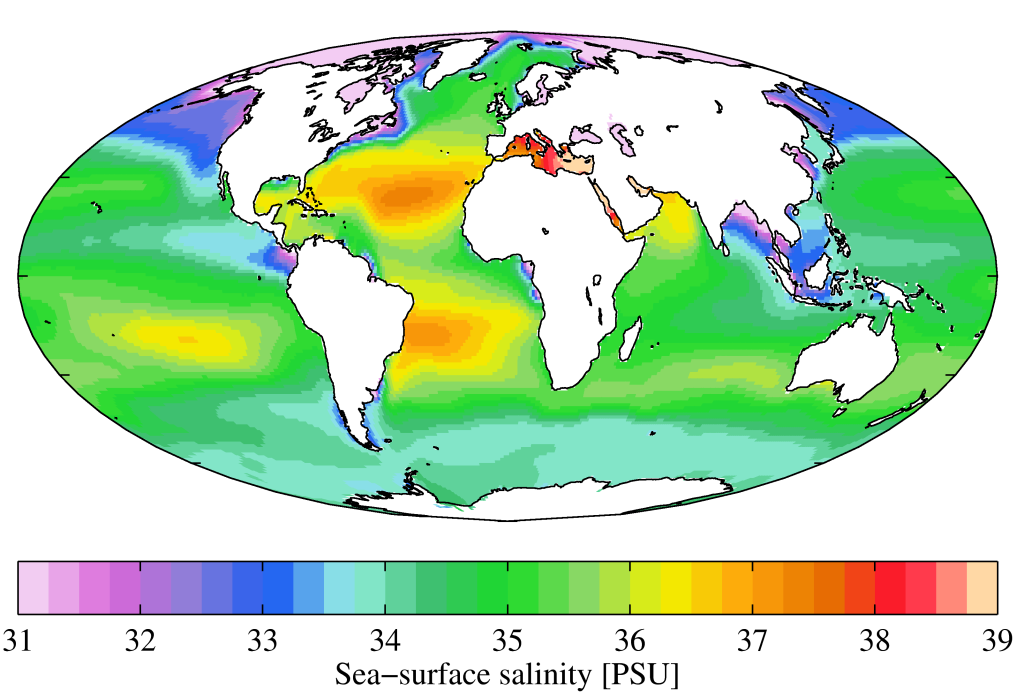
However, salinity varies in the oceans. It is higher in regions of high evaporation and/or low precipitation, and lower where river water or ice enters the ocean. However, the salinity is also affected by ocean currents, and by the freezing of ocean water to make sea ice in arctic regions.
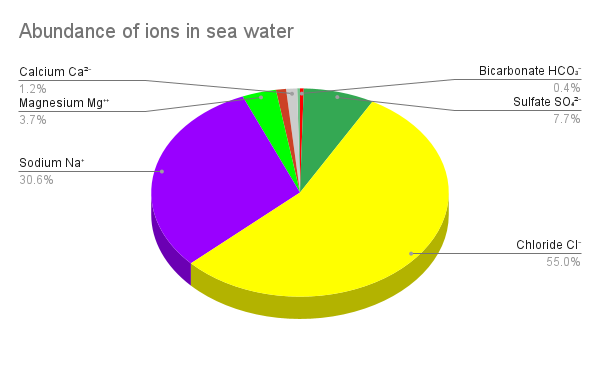
Over 99.7% of ocean salinity is made up of the following seven ions:
- Chloride Cl– (55%)
- Sodium Na+ (30.6%)
- Sulfate SO42- (7.7 %)
- Magnesium Mg2+ (3.7%)
- Calcium Ca2+ (1.2%)
- Potassium K+ (1.1%)
- Bicarbonate HCO3– (0.4%)
 |
 |
This list is significantly different from the list for typical river water[1].
- Bicarbonate HCO3– (33.4%)
- Calcium Ca2+ (19.4%)
- Sulfate SO42- (15.3 %)
- Silica SiO2 (8.6%)
- Chloride Cl– (7.4%)
- Sodium Na+ (7.4%)
- Magnesium Mg2+ (4.9%)
- Potassium K+ (1.7%)
- Nitrate NO3– (1.2%)
To understand why, we need to look at sources and sinks for ions. Sources are the places that dissolved material comes from. Although thes are principally rivers, there are other sources, notably hot springs on the sea floor associated with submarine volcanic activity. Sinks are processes that remove ions from sea water. There are many, but the most important are the following (together with the ions mostly affected):
- extraction by living organisms to produce shells (primarily calcium, bicarbonate, silica),
- sorption: attachment to the surfaces of clay minerals (mainly potassium and sodium),
- removal to land in sea spray resulting from wind and wave action (all dissolved ions),
- reactions with seafloor rocks (e.g. sulfate),
- precipitation of minerals when seawater is evaporated (sodium, chloride, calcium, sulfate).
The present composition of sea water is the result of a balance between these processes. The bulk composition of seawater likely has likely remained fairly constant over geologic time, although salinity was probably lower early in Earth history, and the concentrations would have been different prior to about 2.0 Ga, when there was very little oxygen in Earth’s atmosphere. Without oxygen, it’s likely that the concentrations of sulphate ions was lower, and that there were appreciable amounts of iron (Fe2+) and sulfide (S2-) ions.
Temperature
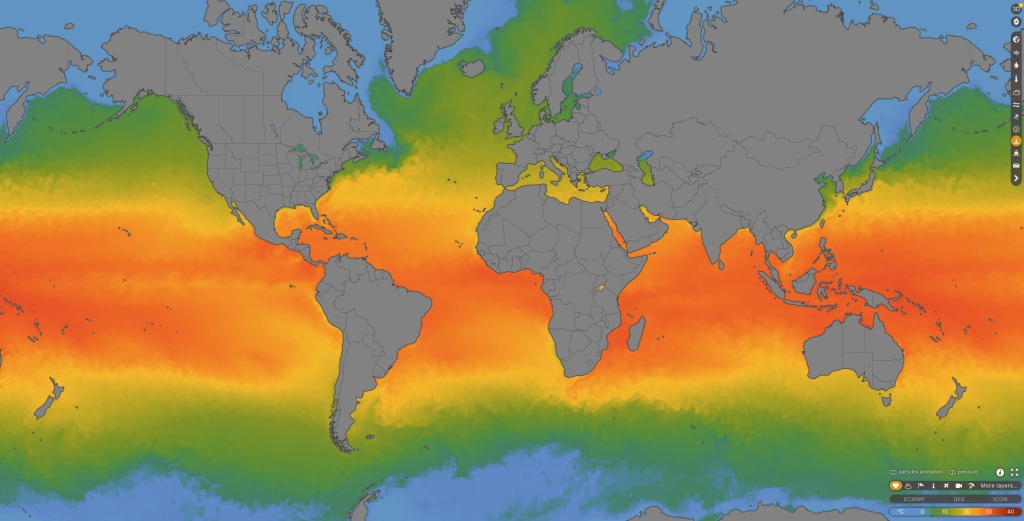
The temperature of seawater varies in a manner similar to the atmosphere, although water temperatures are less extreme, both in the tropics, where they reach just over 30°C, and at the poles, where the lowest water temperatures are around -2°C, the freezing point of seawater. The freezing point of seawater is a little lower than that of pure water, because dissolved ions inhibit the formation of ice crystals. When ice does form, however, it is almost pure water. All the dissolved ions remain in the leftover seawater, so its salinity goes up when sea ice forms.
The overall pattern of N–S variation is affected locally by ocean currents and by upwelling, which brings cold water up to the surface from depth. Both topics are discussed in following sections.
Variation with depth
There are big variations in temperature and pressure with depth in the oceans; the composition also varies, though less dramatically.
Temperature
Overall, temperature decreases with depth. This is because water becomes denser as it cools, down to a maximum density at 4°C. As a result, cold water sinks, and the temperature of the deepest ocean water hovers around 4°C.
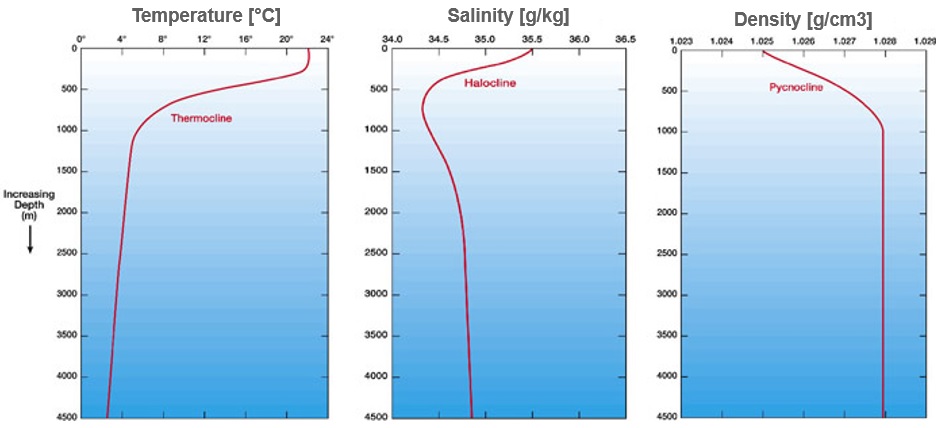
The decrease of temperature with depth is not uniform, however. In most parts of the oceans, the fall in temperature mostly occurs between 100 and 1000 m below the surface, a region known as the thermocline.
Salinity
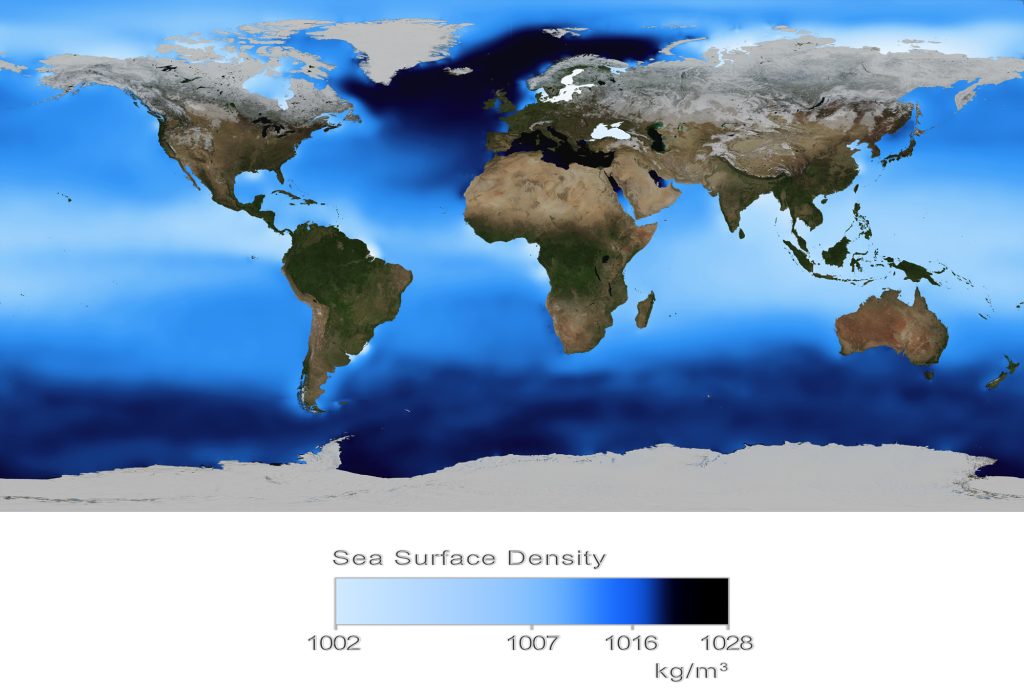
Salinity also varies with depth but in a way that is much more variable. Saltier water is mainly generated at the ocean surface, by evaporation in the tropics, and by the formation of sea ice near the poles. However, density increases with salinity, so more saline water tends to sink, especially near the poles (where it is also cold) and accumulate in deeper parts of the ocean basins. Hence polar regions tend to show an increase in salinity with depth, but more temperate regions may show a decrease in salinity with depth, or a combination of decrease and increase as in the example shown in the figure.
Regions of rapid salinity change are called haloclines.
Density
Water is much less compressible than air, but it is also much denser, so pressures in the deepest parts of the ocean are very high. In the Marianas Trench, 11 km below sea level, the pressure reaches over 108 MPa (over 1000 atmospheres). This pressure produces only a 4% reduction in the volume of water, corresponding to a 4% increase in density.
Other factors affecting density are decreasing temperature, and increasing salinity, both of which tend to increase the density of water at depth. The density increase with depth is spread over about 1000 m below the ocean surface, a region which is known as the pycnocline.
Ocean currents
There are two large groups of ocean currents. Deep currents, driven by density differences caused by temperature and salinity changes, are called thermohaline currents. They account for 90% of the global-scale movement of water in the oceans. The other 10% of water movements are much more obvious but they only affect roughly the upper 100 m of the oceans. These surface currents are driven by wind and tides and shaped by the Coriolis effect. The patterns of surface circulation are extremely complex, as shown by a snapshot of modelled ocean-surface currents.
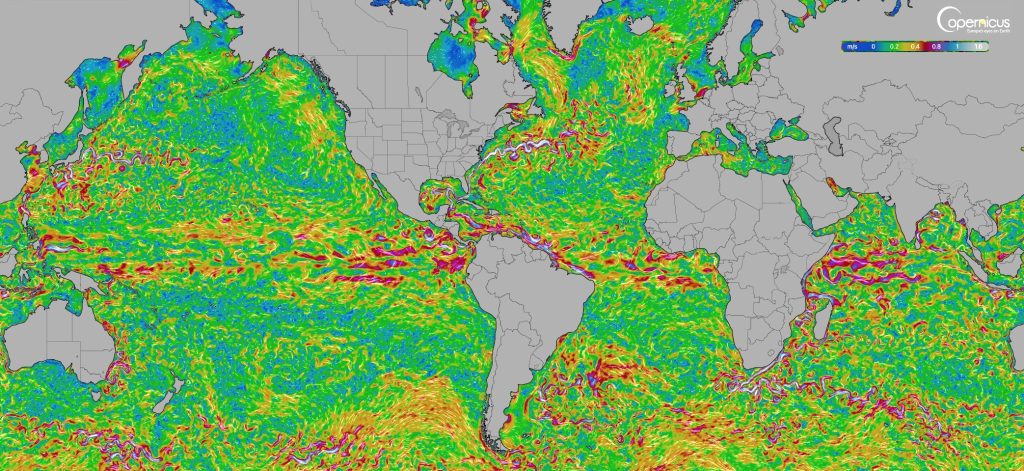
Although this pattern of ocean circulation is extremely complex, once it is averaged over time, some overall patterns emerge. In these overall patterns, it’s possible to distinguish two main types of currents. Currents near the ocean surface are mostly driven by wind, whereas deep circulation is driven by density variations caused by temperature and salinity.
Deep thermohaline currents
Thermohaline currents are driven by variations in the density of seawater. In particular, Arctic and Antarctic near-surface water is chilled by the very cold atmosphere, to which it continually loses higher-energy molecules by evaporation and sublimation. When it freezes (at about -2°C), the ice cannot accommodate salt in its crystals, so the remaining water becomes more saline, further increasing its density.
The dense masses of cold water tend to sink especially in the North Atlantic Ocean.
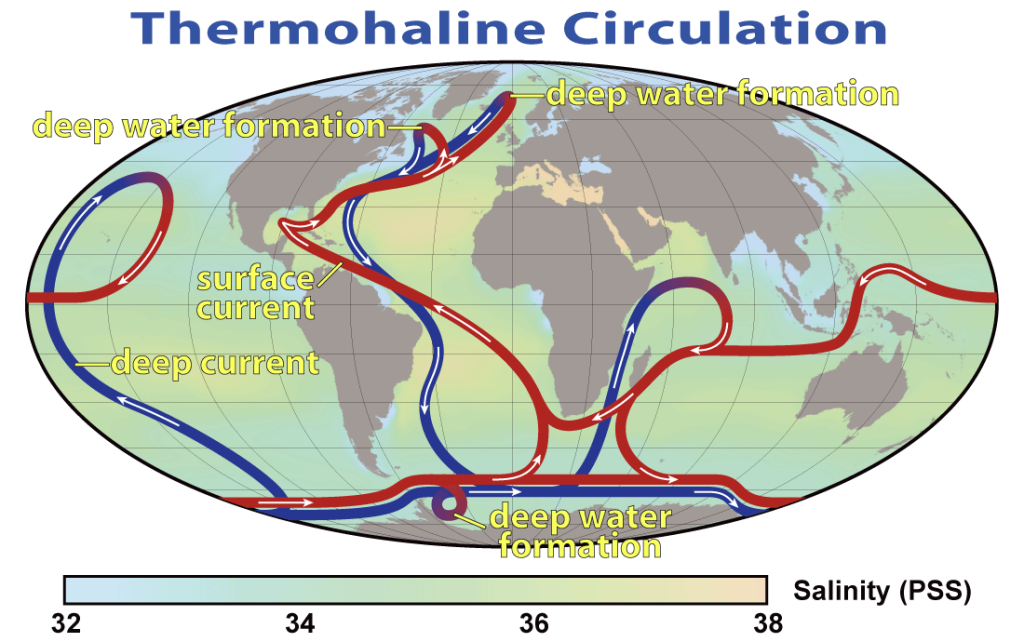
These cold sinking masses of water and flow southwards near to the ocean floor, where they are known as:
- North Atlantic deep water (NADW)
- Antarctic bottom water (ABW)
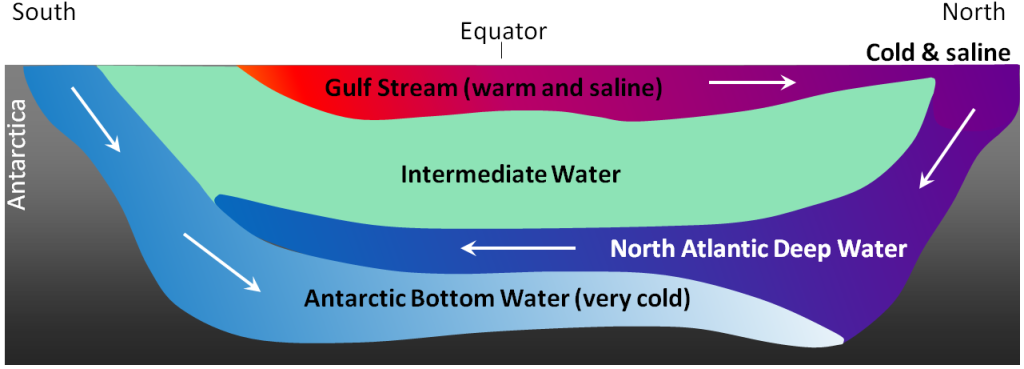
Both flow towards equator, where North Atlantic deep water flows over the even colder Antarctic bottom water and mixes with it. The mixed cold water continues south at depth towards the southern ocean. Some of this water warms slightly and flows back north as Atlantic intermediate water (AIW). Much of the rest is deflected east, driven by the Coriolis effect, towards the Indian and Pacific oceans. The cold deeper water that reaches the Indian and Pacific Oceans flows north and rises as it warms. It’s then drawn into the Atlantic to replace the cold water flowing out. It flows north as the warm Gulf Stream, which brings notably warm temperatures to northern Europe (considering its latitude), and completing the cycle of global thermohaline circulation. These thermohaline currents account for 90% of the large-scale movement of ocean water, and play a major role in redistributing Earth’s heat and controlling climate.
Wind-driven surface currents
The sun heats the planet unevenly, resulting in energy differences which lead to prevailing wind directions. The drag force caused by these winds passing over ocean water creates surface currents, which may persist even when the driving winds have died down. The pattern of currents is extremely complex on any given day but when currents are averaged over time some major patterns appear. Many of these currents were exploited by mariners to move vessels in the absence of wind during the age of sail.
Like flow in the atmosphere, these currents are deflected from straight-line paths by the Earth’s rotation because of the Coriolis effect. The deflections are to the right (clockwise) in the northern hemisphere and to the left (counterclockwise) in the southern hemisphere. As a result, surface circulation is dominated by five large gyres driven by the Coriolis effect:
- North Atlantic
- North Pacific
- South Atlantic
- South Pacific
- Indian Ocean
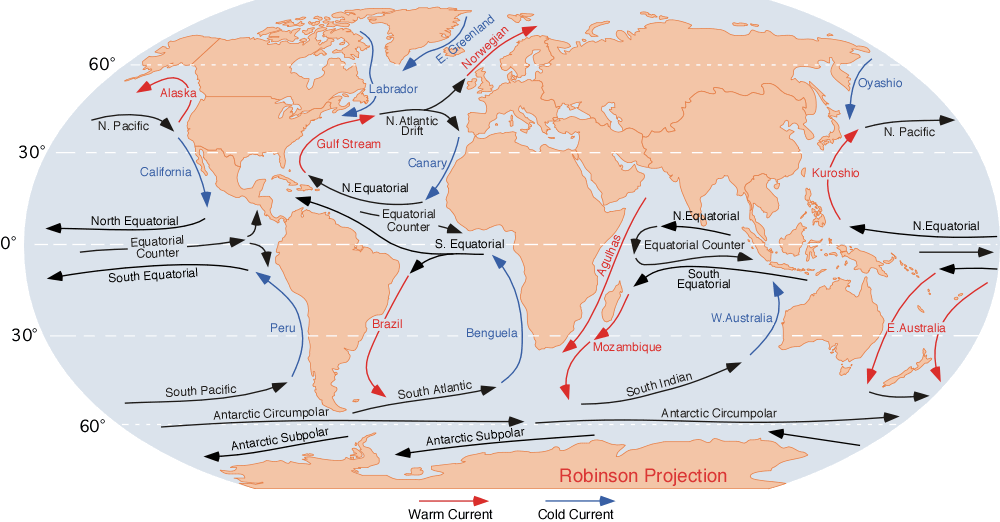
These gyres produce strong westward flows just north and south of the Equator in all the major oceans, the North and South Equatorial Currents. Between them, a narrow Equatorial Counter Current locally flows from west to east. This west-to-east flow is particularly prominent in the Pacific Ocean in El Niño years. A second global circulation occurs in the Southern Ocean, where the eastward flow of the major oceanic gyres combines to create the eastward Antarctic Circumpolar Current. There is no corresponding circumpolar flow in the northern hemisphere because the corresponding latitudes are obstructed by the continents North America and Asia.
Surface circulation is important to humans, both for navigation and because of its interaction with the atmosphere and weather. In the North Atlantic Ocean, surface and thermohaline circulations combine to produce the Gulf Stream, which delivers warm water to Europe, making the temperatures there considerably warmer than other parts of the land at corresponding latitudes. Worldwide, however, surface circulation is responsible for moving only about 10% of the large-scale ocean water flux.
Ekman transport and upwelling
The action of the wind on the ocean, in combination with the Coriolis effect, has some surprising consequences for surface currents.
When wind blows on the surface of the ocean in the Northern Hemisphere, the Coriolis effect causes surface water to be deflected to the right, clockwise of the direction of the wind drag on the ocean surface. In the southern hemisphere, the deflection is to the left, counterclockwise of the wind. The surface water in turn exerts a drag on the water below, which is moved a little slower, but deflected farther to the right or left, depending on the hemisphere. That water in turn drags even deeper water, which is further deflected. The result is that the movement directions of the water outline a helical path, a little like a snail shell, as they are traced downwards. This phenomenon is known as an Ekman spiral. If the directions of all the water flows are added together, it turns out that the net overall transport of water is at 90° to the wind direction, a somewhat surprising result known as Ekman transport.
Ekman transport becomes extremely important along the coasts of major continents such as South America, where a prevailing wind blows northward towards the Equator. Ekman transport forces water westward at right angles to this wind direction, directly away from the coast, causing deep water to rise towards the surface, a phenomenon called upwelling. An opposite phenomenon, downwelling, occurs where Ekman transport results in onshore currents that drive water downward.
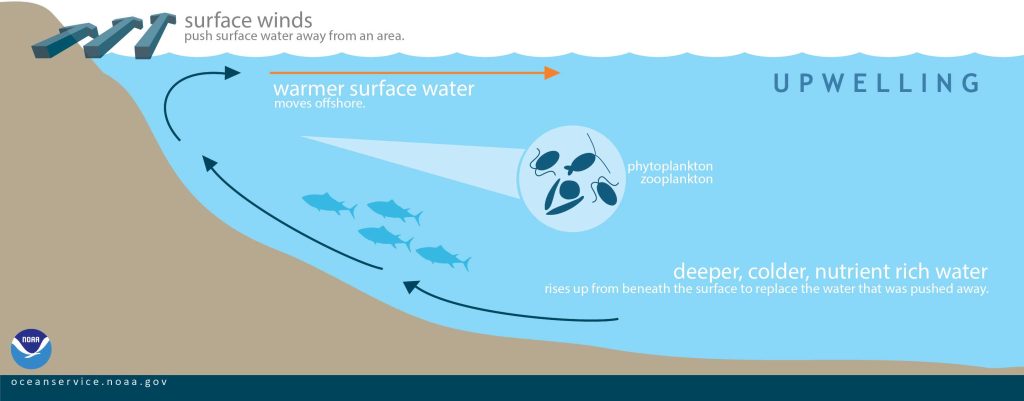
Upwelling along the coast of South America brings cold, nutrient-rich water to the surface where it is important for fish populations that support coastal communities. Interruptions in upwelling that occur in certain years, impacting fish catches, led to the first recognition of the El Niño — Southern Oscillation (ENSO), an episodic fluctuation from year to year that affects both the Atmosphere and oceans, described in more detail in a the section dealing with climate and climate change.
Tides
Tide is the rise and fall of the level of the ocean that originates from gravitational interactions between the Earth, the Moon and the Sun, described in the section on the Solar System. The Earth and Moon rotate around their common centre of gravity. However, the Moon’s gravity on near side of the Earth is stronger than necessary to maintain orbit, which pulls water towards the Moon. Conversely, water on the far side of the Earth experiences less gravitational pull than is required by its orbit, and moves away from the Moon. Most areas experience high tide twice every 24 hours and 50 minutes, the length of a lunar day.
The Sun also causes tides but is approximately half as effective as the Moon. Spring tides occur when Sun, Earth and Moon are in line, creating extreme tides: the highest high tides and the lowest low tides. This occurs approximately once every two weeks. Conversely, neap tides happen when the Sun and the Moon are poaitioned at 90° to each other with respect to the Earth; their effects partially cancel out, generating the lowest high tides and the highest low tides.
![]()
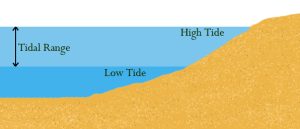
The difference in elevation between the highest and lowest tides in a given location is called the tidal range. On a planet without continents, tides would be strongest at the Equator and weakest at the poles, but the tidal range would be the same everywhere at a given latitude. However, continents get in the way of the tidal bulge, causing huge variations in the height of tides and the strength of tidal currents around the world. In the open ocean, the tidal range is less than 1 m.
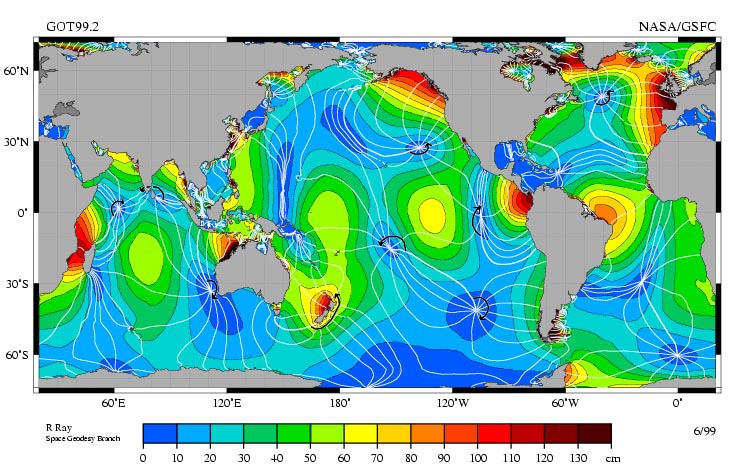
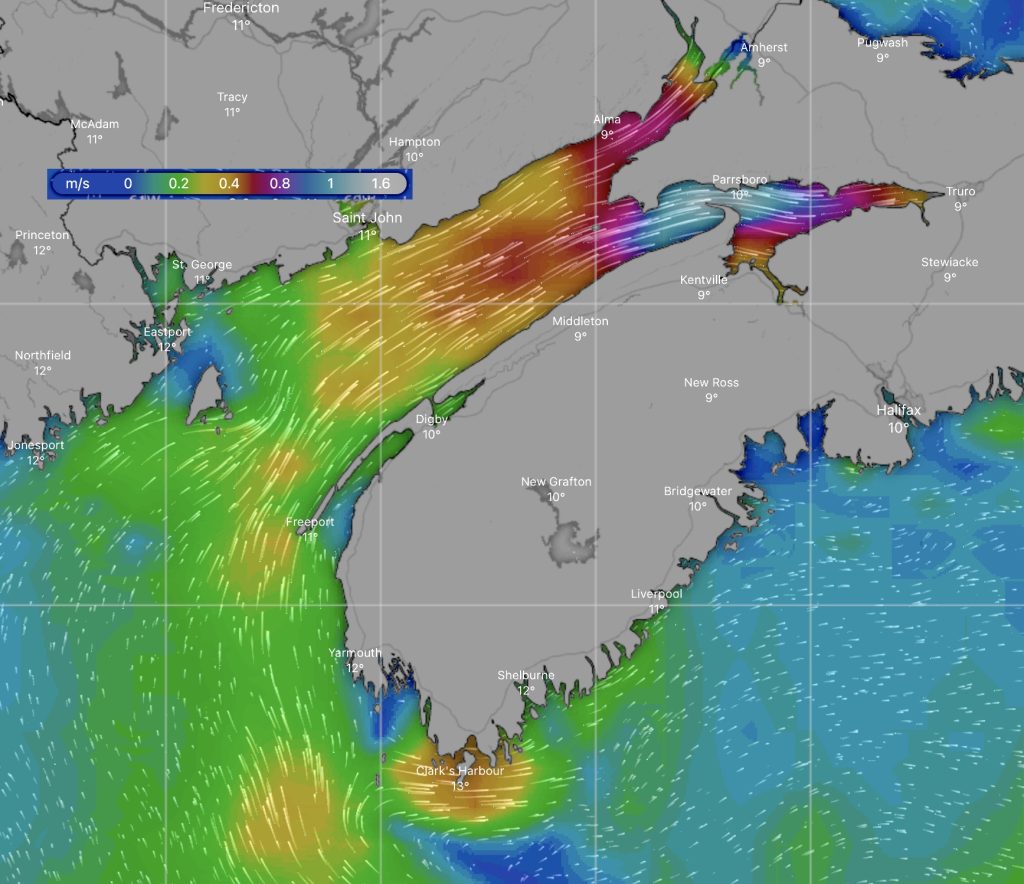
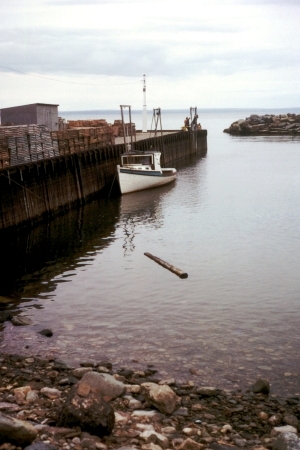
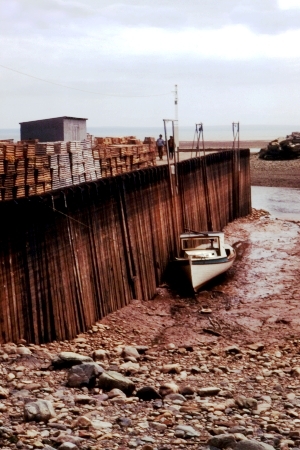
However, the tidal range is amplified by shallow water. Some coastal embayments and inlets have natural oscillation frequencies that are close to the 12.4 hour frequency of the tides, with the result that the tidal oscillation is strongly amplified. This is especially apparent in funnel-shaped inlets like Bay of Fundy, where the tidal range reaches 16 m and tidal currents may exceed 5 m/s
The photographs at the right show high and low tide at Alma New Brunswick, Canada, on the north shore of the Bay of Fundy.
Waves
Waves most commonly form as a result of the drag force exerted by wind wind blowing across the surface of the ocean. The size of the waves depends on the strength of the wind, the duration of the wind, and the fetch — the distance across the water over which the wind blows uninterrupted by land.
Waves can be caused by earthquakes, volcanic eruptions, and landslides: these waves are known as tsunami waves[2].
Although waves give the appearance of moving large amounts of water in the direction of wind, this is largely an illusion. The motion of water follows looping orbitals, so water moves back in the wave troughs as far as it moves forward in the wave crests, as shown in the animation of a gull. Waves transfer energy in the direction of wave travel, but not water — the movement of water in the wave direction (as described in the section on surface currents) is very much slower.
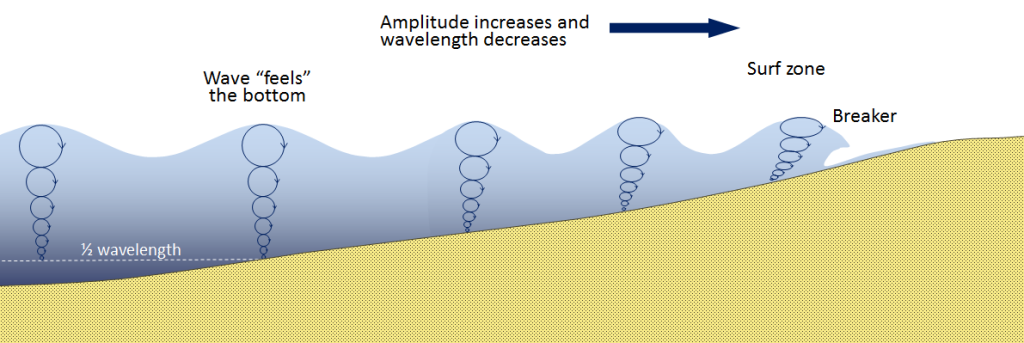
Below the surface, wave motion decreases downward to the wave-base (roughly at a depth of about half of the wavelength), where it becomes negligible.
As waves enter water that is shallower than this wave-base, the wave orbitals begin to flatten because of drag[3] as the wave interacts with the base of the seafloor. The wavelength becomes shorter (the waves get closer together) and individual waves get higher (the amplitude increases). In the surf zone the wave crests begin to move forward faster than the deeper water (which is moving slower due to drag), causing the waves to ‘break’ into a mass of turbulent foamy water with trapped air.
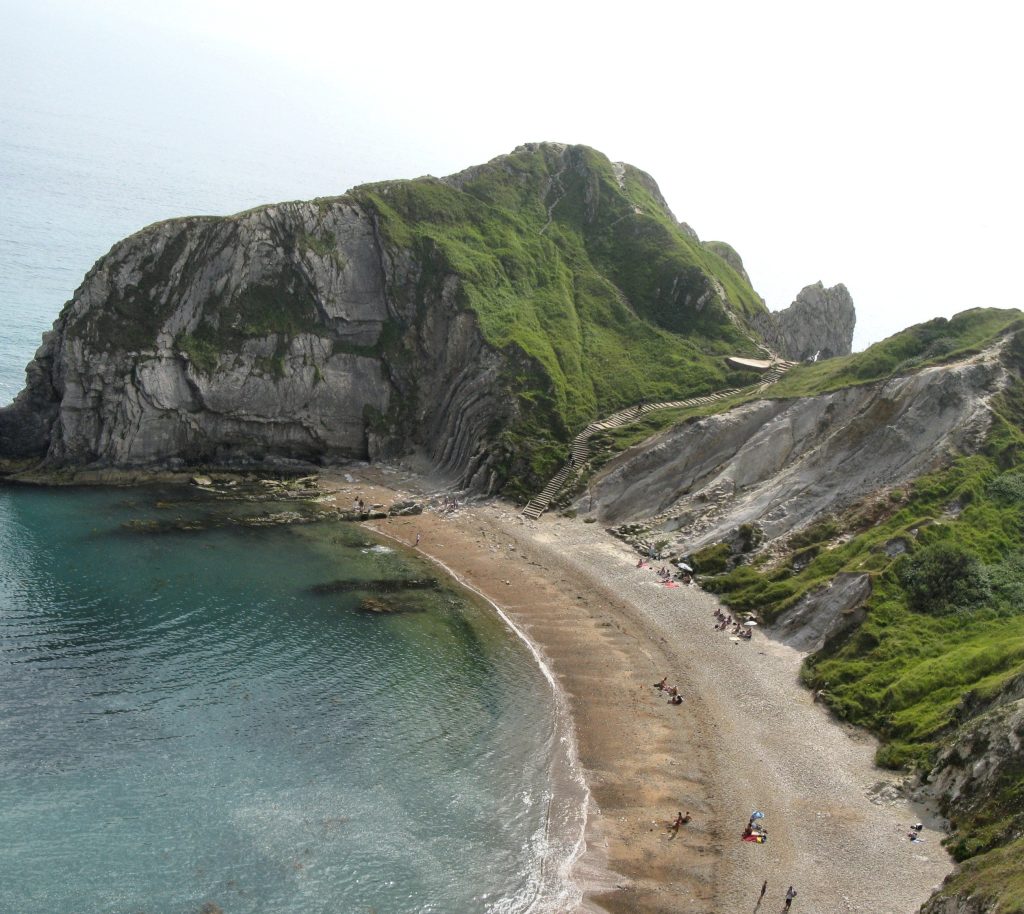
The fast-moving wave crests may pound against upstanding rocks and cliffs along the shoreline, and commonly cause erosion. The water thrown onto the shore by a breaking wave runs back offshore as the next wave approaches, adding to the drag on the base of the wave.
Although waves sometimes approach the shore orthogonally (head on), it is more common for waves to approach the shore obliquely (diagonally). As they are slowed down by shallow water, they may be refracted (bent) so as to become more parallel to the shore.
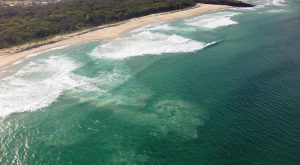
Despite this refraction, there is a tendency for water to travel obliquely onto the shore as waves break, but then to flow back orthogonally in response to the slope. As a result, water is carried gradually along the shore in what is known as a longshore current.
Longshore currents may feed localized rip currents that return water offshore again. Rip currents are extremely hazardous to swimmers. Swimmers who find themselves being carried offshore by rip currents are typically advised to swim parallel to the shore rather than fighting against the offshore current, because most rip currents are localized to certain portions of the shoreline.
![]()
Longshore currents carry sediment as well as water. Longshore drift is the term applied to this transport of sediment by a longshore current. Longshore drift is very important in forming beaches (by moving sediment from point sources such as rivermouths, creating a beach that extends along the coast, and may extend out as a spit into the sea at a headland. Beaches protect coasts from major storms, so in some areas maintaining the supply of sand through longshore drift is important for environments and human communities.
Sea-level change
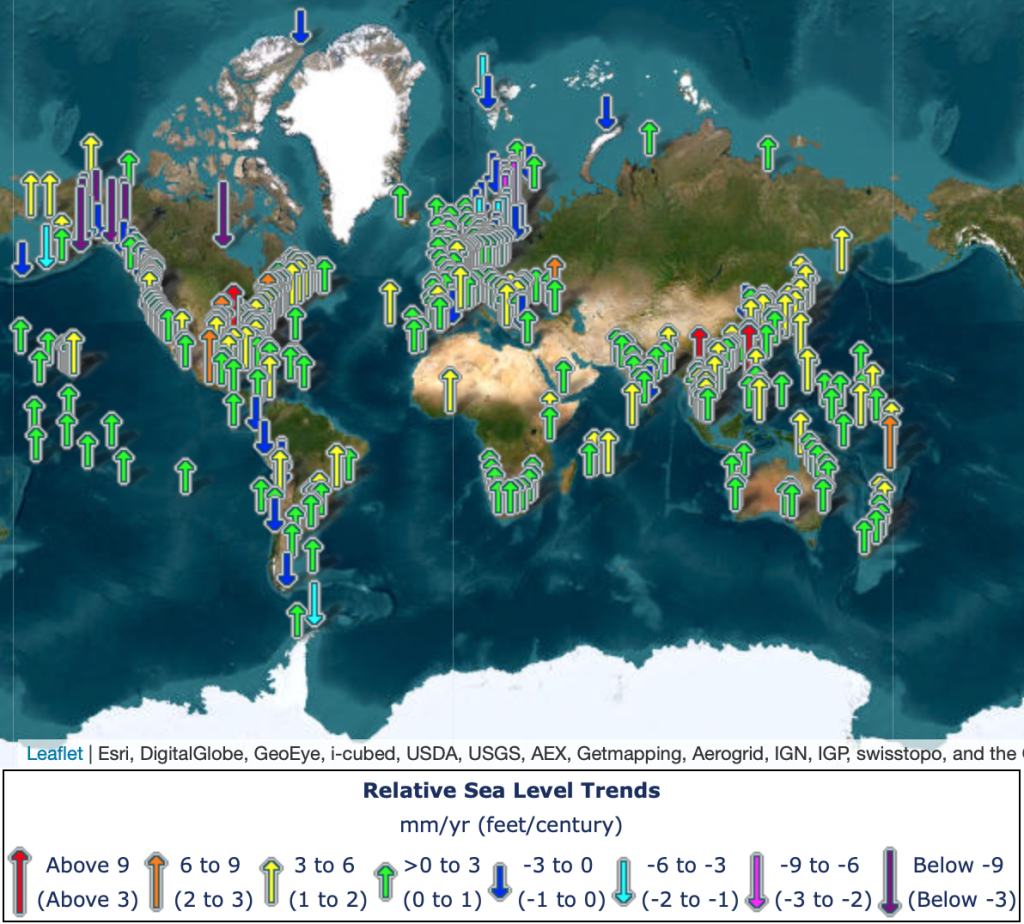
In most areas on the Earth, there are in sea level relative to land that operate on much longer timescales than waves or tides, which can result in either the submergence of existing land or emergence of land that was once underwater. To detect these changes it’s necessary to have records that extend over years, decades, or longer, so as to average out the short-term fluctations due to waves and tides.
These changes result from a combination of worldwide sea-level effects, which are called eustatic changes, and regional effects that are confined to part of the globe. Both types of sea-level change have several possible causes.
Eustatic (global) sea-level change
Expansion and contraction of glaciers
As the volumes of glaciers, particularly ice sheets and ice caps, has changed over time, sea level has changed. In cool periods, glaciers sequester significant amounts of water from oceans with the result that global sea-levels are lowered. When glaciers they melt, they return more water to the oceans and sea-level rises.
There is a second major way that climate change affects global sea-level. As water warms above its maximum density at 4°C, thermal expansion occurs, so volume of the ocean water with temperature change – is another cause of eustatic change.
From the last glacial maximum (LGM) about 20,000 years ago until the present day, global mean sea level has risen around 125 m relative to the land. About two thirds of this is probably due to the melting of continental ice sheets and the other on third to thermal expansion of seawater .
Changes in the volume of the ocean basins
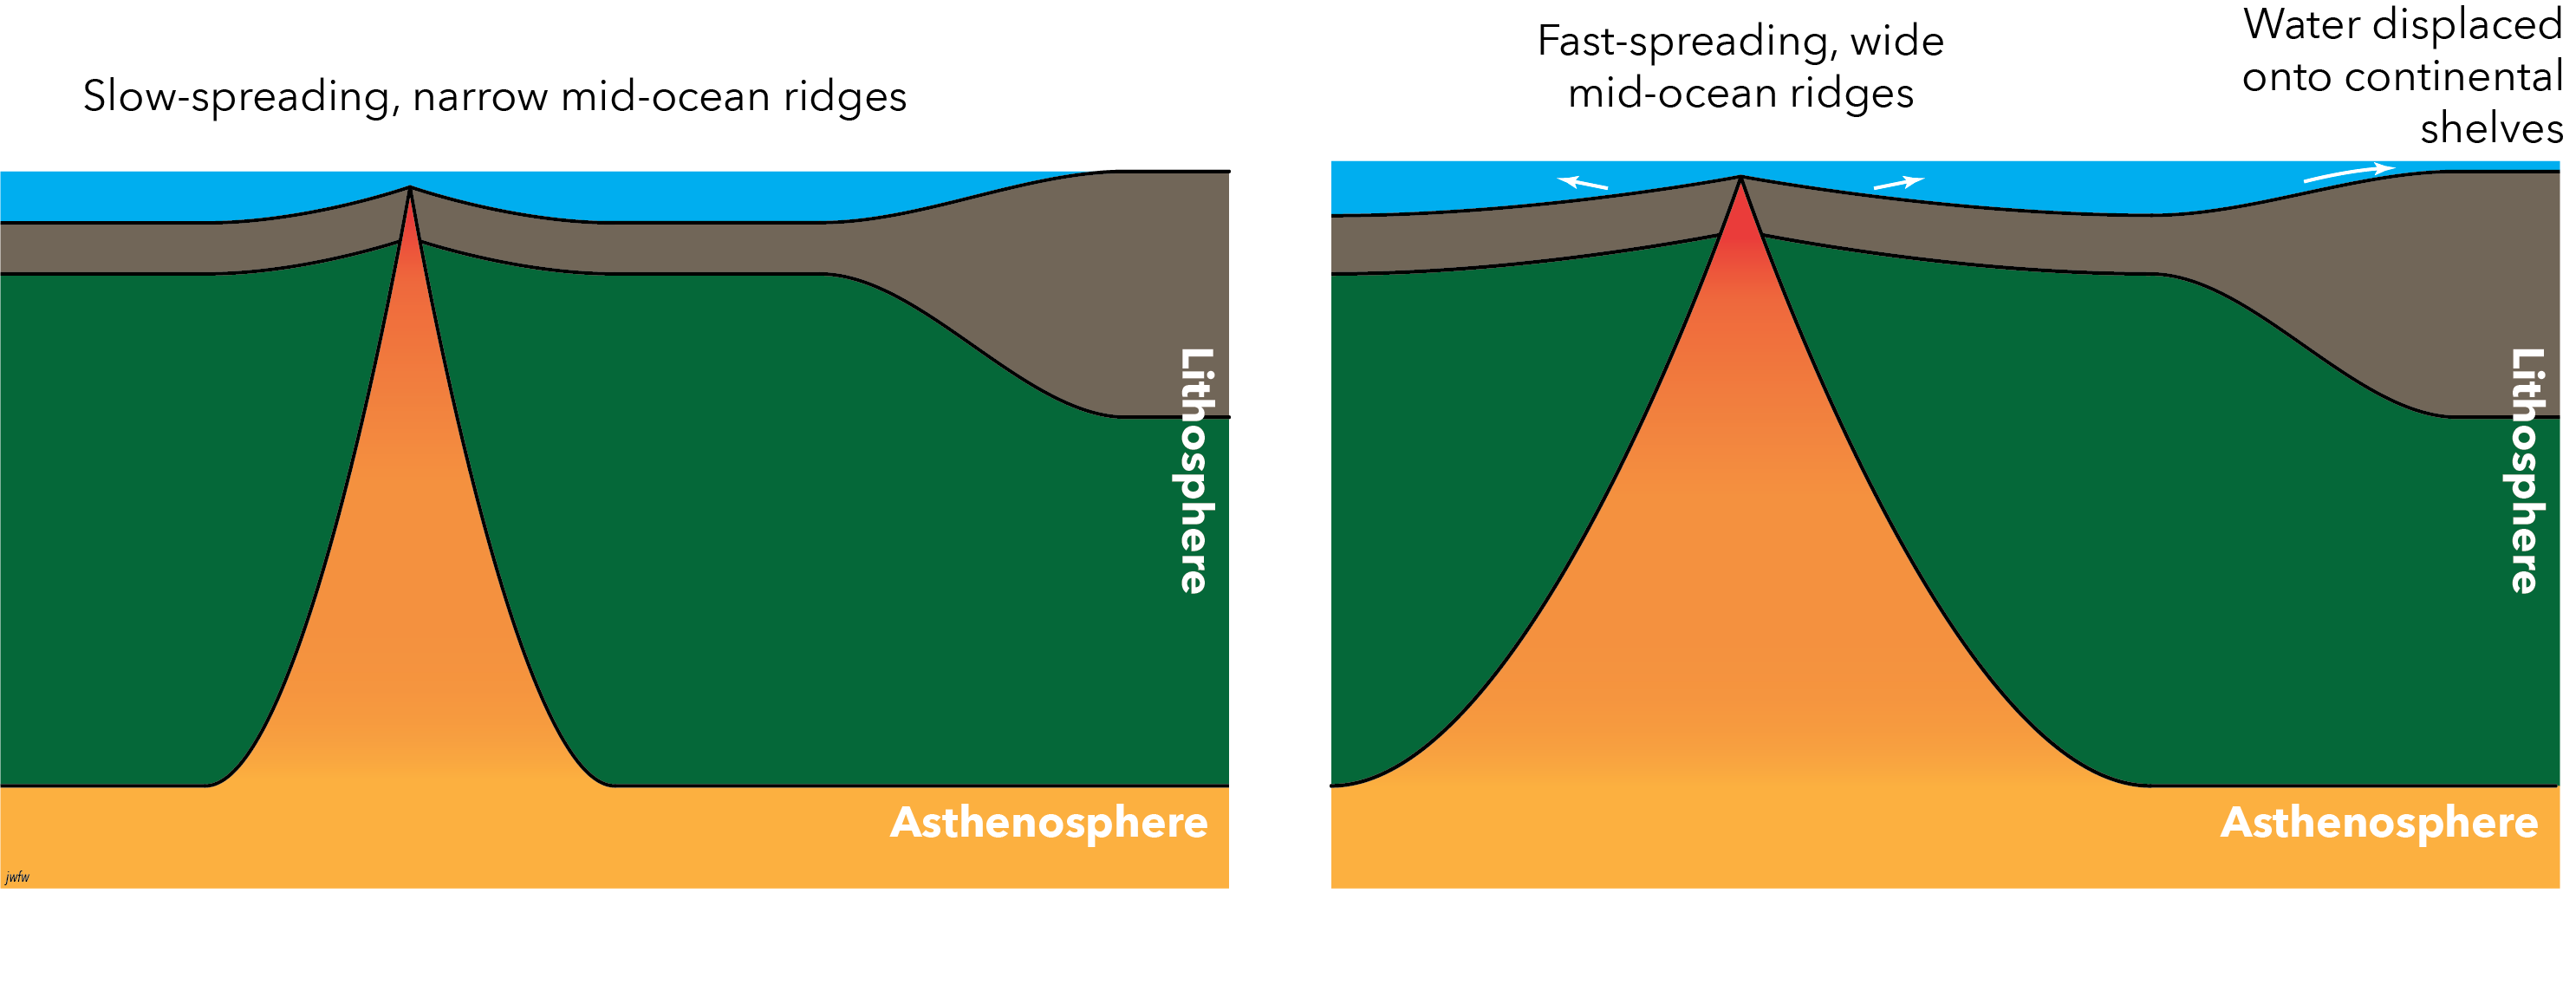
There are other causes of eustatic sea-level change that contribute to rises and falls of sea level over even longer time scales: tens or hundreds of millions of years. The volume of the ocean basins changes with time, as tectonic plates move and rearrange themselves. This is because spreading centres — places where the plates move apart, typically at a few centimetres per year — are marked by mid-ocean ridges. These substantial ridges rise about 2 km above the surrounding abyssal plains, making the ocean much shallower over their crests. These ridges are wider where spreading is rapid, and they take up a lot of room in the ocean basins, displacing water out onto the continental shelves[4]. At times of rapid plate movement, more water is displaced in this way and sea-level rises. Coversely, a reduction in tectonic activity leads to eustatic sea-level fall. This effect may explain a period at the end of the Mesozoic Era from about 100 to 65 Ma when there were broad continental shelves and inland seas on many continents.
Local sea-level change
Local to regional changes that move the land up and down occur in many parts of the world. The main causes are:
- Isostatic responses to features such as ice caps and ice sheets.
- Tectonic movements
- Compaction of sediments
Although these movements are best understood as movements of the land, they are perceived by most human inhabitants as movements of the sea. The effects of these movements are either to add to, or to offset, worldwide eustatic changes.
Isostatic responses
The lithosphere, the relatively rigid outer part of the Geosphere rests on the asthenosphere below, which is still solid but able to flow plastically. As a result, the lithosphere behaves as if it is floating on the asthenosphere, a phenomenon known as isostasy. When a weight, such as an ice sheet, is added to the lithosphere, the lithosphere responds by sinking somewhat into the asthensophere; this phenomenon is called isostatic subsidence. When the weight is removed, the lithosphere rises again. However, there is a delay, typically measured in thousands of years, because the asthenosphere is very viscous; it therefore flows very slowly. The time delay after melting of an ice sheet can actually be used to measure the viscosity of the asthenosphere.
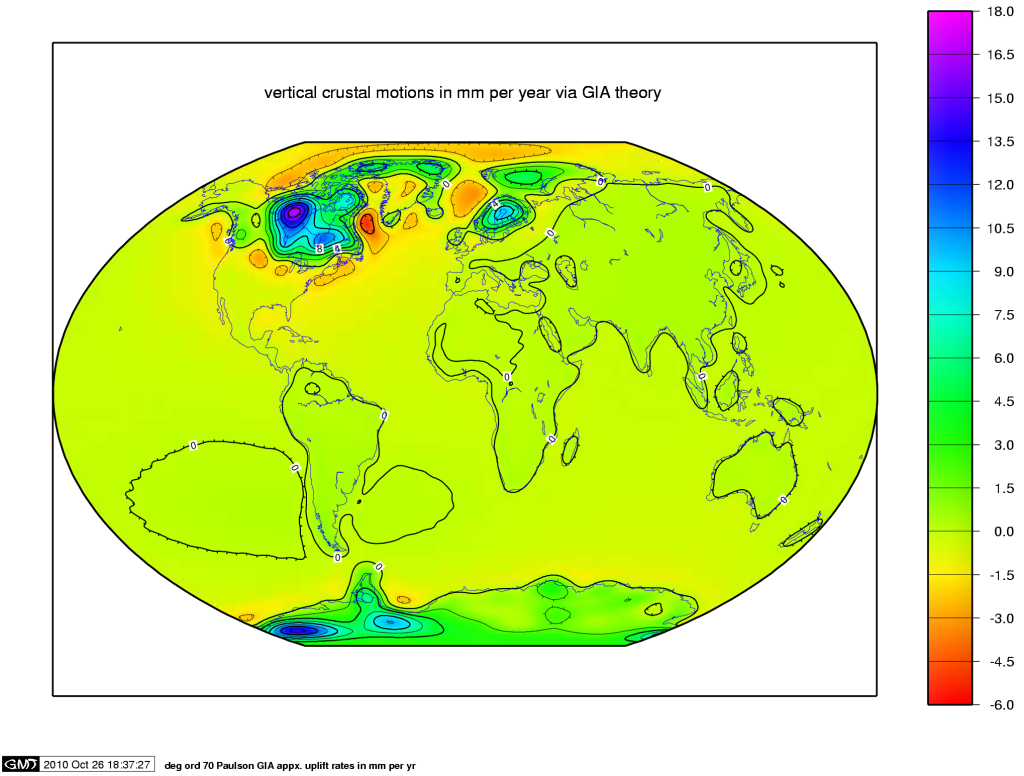
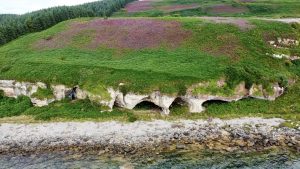
Large parts of Canada and northern Europe are still responding to deglaciation that occurred between ~12 and 10 ka. Some places currently see rates that exceed 1 cm per year. In these areas the rate of isostatic rebound has exceeded the rate of eustastic sea-level rise, with the result that former coastline features are preserved as raised beaches, metres to tens of metres above present-day sea level.
In contrast, along coastlines where the glacial ice was thin or absent during the last glacial maximum show little or no rebound, with the result that eustatic sea-level rise predominates. These coastlines are characterized by numerous estuaries, formed as the sea has flooded former river valleys, and locally display features like drowned forests.
Tectonic movements
Tectonic movements are movements of the Lithosphere. The lithosphere is the outer, rigid part of the Geosphere that is divided into plates that move relative to one another over the softer Asthenosphere below, at speeds of a few centimetres per year, as described in more detail in the chapter on plate tectonics.
Where one plate moves over another, at subduction and collision zones, the upper plate rises and the lower plate is pushed down into the asthenosphere.
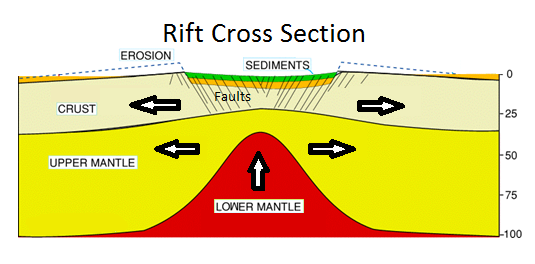
Vertical movements also occur at rift zones, places where plates are starting to move apart. Hot asthenosphere rises beneath the lithosphere and heats it. Thermal expansion reduces the density lifts the land surface as a result of isostasy in a broad region, but in the central part of the rift, faults typically develop in the upper part of the lithosphere (the crust), and a central region subsides. Rifts therefore typically show complex patterns of rising and falling land. If a rift zone occurs at the coast, this appears as falling or rising sea-level.
Vertical tectonic movements are typically slower than horizontal plate movement, but may still operate at speeds measured in millimetres per year, comparable to the rates of eustatic sea-level change. Thus although sea-level is rising eustatically at the present day, the coastlines of areas undergoing active tectonic uplift or post-glacial rebound experience a relative fall in local sea-level.

Relative sea-level change due to compaction of sediment

In areas where sediment is deposited rapidly, such as deltas, the sediment is initially waterlogged. This is particularly true of fine-grained sediment — mud — which may contain more than 60% water when first deposited. Over time, the addition of more sediment causes compaction of what’s below as the water is squeezed out. This may result in a fall of the land surface relative to sea-level, especially if the supply of sediment is cut off (for example by human activity upstream in a river system). Subsidence due to sediment compaction may be further exacerbated if humans remove water from loosely consolidated aquifers.
Deposition on coastlines and the seafloor
Much of the sea and ocean floor is covered by sediment. The sediment comes from a variety of sources. Clastic sediments, the solid products of weathering, are most commonly derived from the land and transported to the seas and oceans, mainly by rivers. Such sediment is called terrigenous, meaning “derived from land”. Other types of sediment are extracted from the dissolved content on seawater by the action of living things, or through evaporation. A small amount of sediment is derived from the ocean floor itself, either from seafloor erosion of volcanic rocks or by deposition from hot groundwater (hydrothermal water) that escapes from the seafloor.
We will begin with a look at the terrigenous sediment that is mostly deposited near the coast, in estuaries, deltas, and beaches. Then we will look at the continental shelves and adjacent continental slope and rise systems. Finally, we will describe the most important types of pelagic sediment, deposited out of reach of land on the deep ocean floor.
Calcareous and siliceous oozes, formed of shells, can only form where there is essentially no clastic sediment deposition.
Coastal clastic sediment
Deltas
Deltas form in areas where sediment-laden rivers reach the coast. River water slows down when entering the sea, which reduces its ability to carry solid particles. Bed load tends to stop moving first, while suspended load travels as a cloud of turbid water farther out to sea. Fine-grained particles of clay minerals may clump together when they enter saline water, which increases their rate of settling. The result is that some river mouths are marked by huge piles of sediment that may be kilometres thick. A typical example occurs at the mouth of the River Nile on the Mediterranean coast of Africa, where the sediment is deposited in a roughly triangular area that was named delta after the Greek capital letter Δ. On the top surface of the sediment pile, the River Nile branches downstream into multiple distributaries. The same name — delta — is given to similar bodies of sediment at the mouths of other rivers, even when they are not triangular in shape. For example, the Mississippi River empties into the Gulf of Mexico where it forms a multi-branched bird’s-foot delta. The difference probably reflects a greater amount of wave action in the case of the Nile, which builds a protective beach around the edge of the delta through longshore drift.
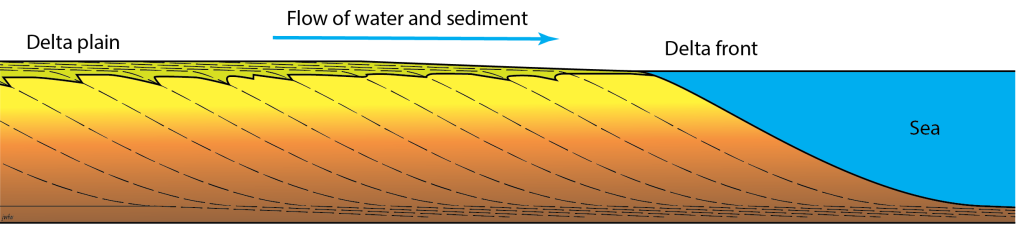
Most deltas evolve through time, building outwards, or prograding into the sea as sediment is transported and deposited on the delta front.
In major flood events, the river may break out of the main channel somewhere inland, forming a new distributary, and starting a new lobe of the delta. Major deltas like the Mississippi and the Danube have constructed multiple lobes over periods of a few thousand years. As the sediment supply to a lobe is cut off, it subsides because of sediment compaction, and the top surface is eroded by waves, so it may disappear under the shallow sea.
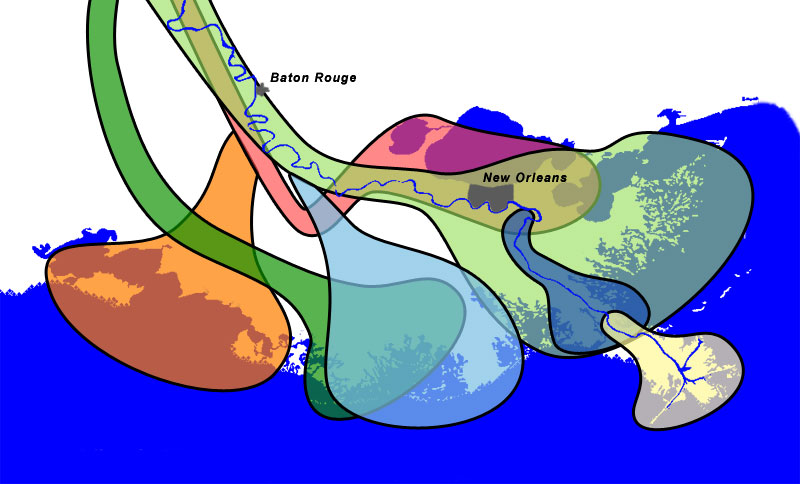
The figure below shows the evolution of the Danube delta, on the border between Romania and Ukraine, since the beginning of the common era.[5]
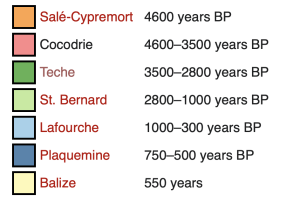
Estuaries
In contrast to deltas, estuaries are river mouths where seawater penetrates into an embayment or into a wide, V-shaped river mouth. Some estuaries are fed by more than one river. Estuaries form in circumstances where the supply of sediment is less than the rate of subsidence plus sea-level rise. They are therefore particularly common in areas where eustatic sea-level change has caused a rise of the sea relative to the land.
Estuaries are affected by a combination of river and ocean-related processes. Fresh water and seawater are mixed together to make brackish water, but in any one place in an estuary, salinity may vary widely with the state of the tide and river discharge, between extremes of less than 1‰ and more than 35‰. Animals and plants that live in estuarine environments typically show adaptations for survival in these conditions of varying salinity. Many estuaries are home to unique species that are not found in either fresh water or normal seawater.
Beaches
Beaches are elongated bodies of sediment that occur at the shores of water bodies. In almost all cases they are built by wave action. Obliquely approaching waves generate longshore transport that removes sediment from river mouths and transports it along the coast. Waves may also add to the sediment by eroding cliffs by the process of abrasion.
Because of repeated transport, sediment on beaches is typically very well sorted. The amount of wave energy determines the grain size: beaches that are heavily pounded by waves may consist of coarse gravel, whereas those that experience gentle wave action may be built of very fine sand.
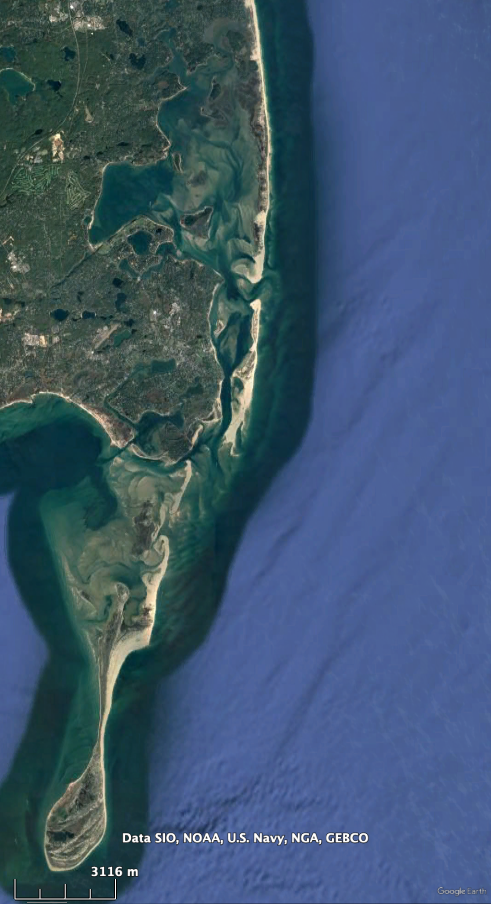
Barrier beaches, formed by longshore drift, are important features along many coastlines, damming small lakes called lagoons and protecting inland areas from storms. At headlands, longshore drift may build an elongated spit out into the sea. Barrier islands are barrier beaches surrounded by the sea.
<images of beaches, barrier beaches, lagoons, and spits.>
 Continental shelves
Many continents are surrounded by large areas of shallow seawater, less than 200 m deep. These are the continental shelves. They are underlain by continental crust, and are therefore geologically part of the adjacent continent. Because of the processes of plate tectonics, many continental shelves subside isostatically over geologic time, so continental shelves may be underlain by accumulations of sediment and sedimentary rock that are several kilometres thick, all deposited in shallow water as sedimentation keeps pace with subsidence. Continental shelves typically lie within the photic zone. The penetrating sunlight allows marine plants to grow, and these fuel abundant animal life. Continental shelves are some of the most organically productive environments in the marine realm.
Clastic continental shelves
On clastic continentals shelves the dominant sediments are sand, where wave action or tidal currents predominate, and mud, where fine-grained sediment settles out in quiet water. Ancient shelf sediments form sandstone and mudstone that may contain abundant fossils (remains of past living organisms) and trace fossils (features such as trackways and burrows formed by the activities of those organisms). Ancient shelf sediments may be so thoroughly disturbed by burrows that the layering — otherwise typical of sedimentary rocks — is almost obliterated.

Carbonate shelves and shorelines
Where terrigenous sediment is scarce, particularly in tropical environments, living organisms produce other types of sediment by extracting ions from seawater. The most common product of this activity is calcium carbonate CaCO3. A variety of organisms are able to pull calcium carbonate out of seawater, including marine micro-organisms (cyanobacteria and algae), many types of shellfish (e.g. molluscs, crustaceans), and corals. Corals, in particular, deposit large calcium carbonate skeletons that build up from the sea-floor to form raised reefs. In almost all cases, animals (like corals) that deposit calcium carbonate are dependent on plants to create the right chemical conditions (relatively high pH) through photosynthesis. Acidification of the oceansdue to human activities is therefore a major threat to these carbonate-producing ecosystems.

Coral reefs are typically high energy environments that are washed by waves. Between a barrier reef and the shoreline there may be a lagoon or a carbonate shelf in which fine-grained carbonate mud is deposited. If clastic input is low, there may be a carbonate shoreline where prokaryotic micro-organisms called cyanobacteria lay down layers of fine-grained carbonate.
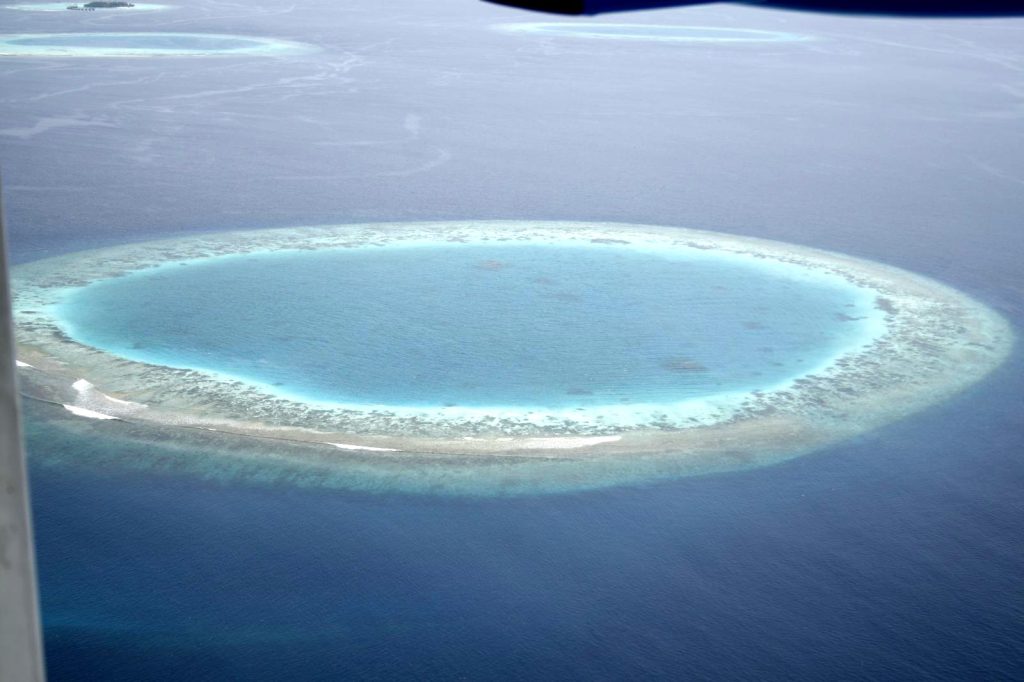
Reefs can also form around volcanic islands in the deeper ocean basins. When the island subsides, but reef growth keeps pace with sea-level, a hollow reef called an atoll is the result. Atolls typically enclose a shallow lagoon where finer grained carbonate sediment accumulates in an environment protected from waves.
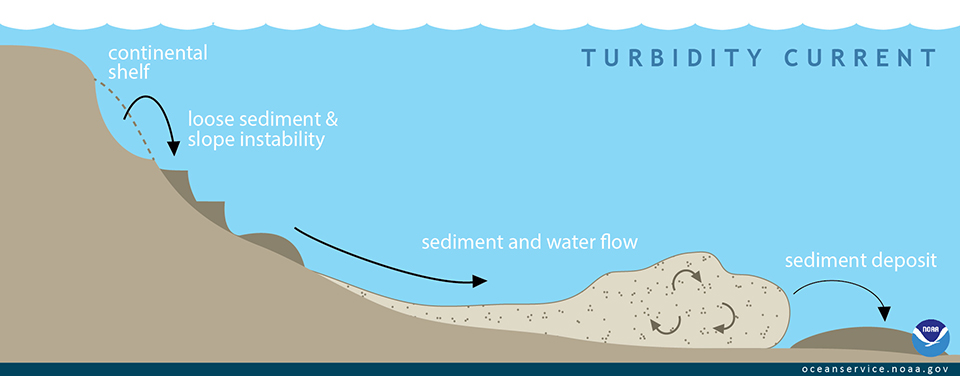
Slope sediments: turbidity currents and submarine fans
On the continental slope, which connects the continental shelf to the deep-sea floor, gravity-driven processes (sediment gravity flows) may move coarse clastic sediment toward the deep-seal floor. The most important process that moves sand-size sediment to the deeper oceans is a type of sediment gravity flow called a turbidity current, in which turbulent flow suspends the sand grains in a submarine “avalanche” that may move at 50 km/hr or more down the continental slope. This is fast enough to cause erosion of the continental slope, so many turbidity currents flow through valleys on the sea-floor called submarine canyons. Historical high-speed turbidity currents have been documented as they moved down-slope severing sea-floor communication cables.
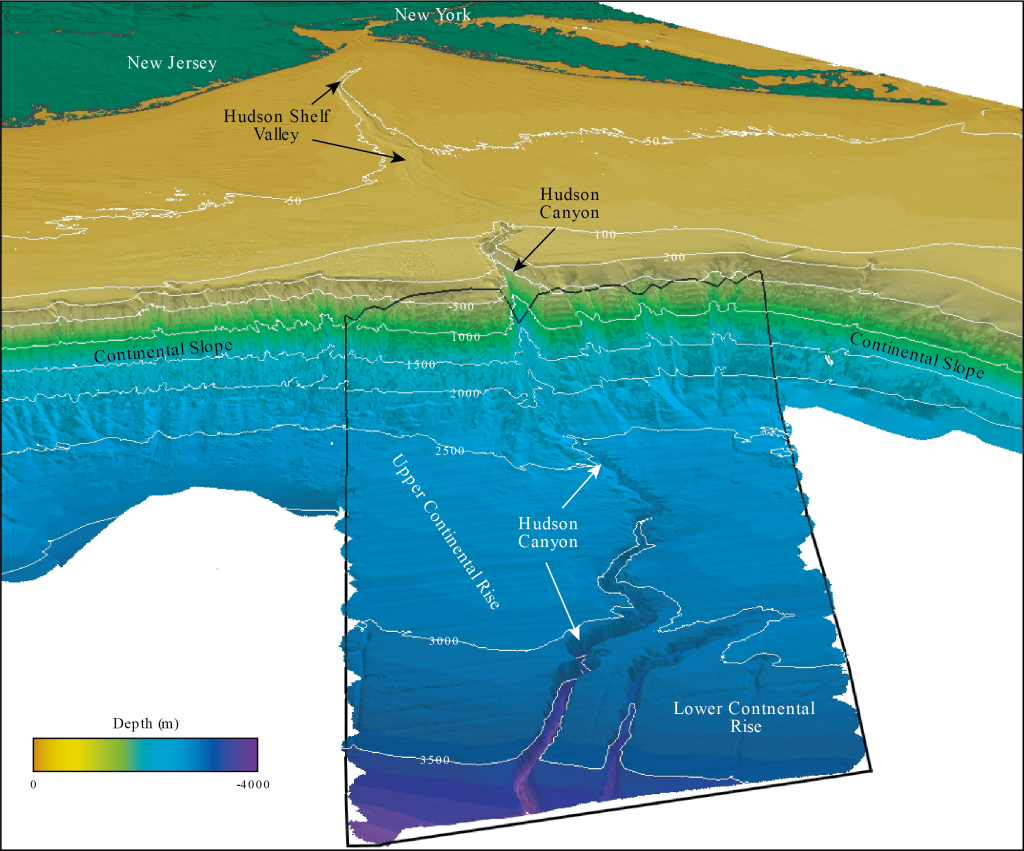
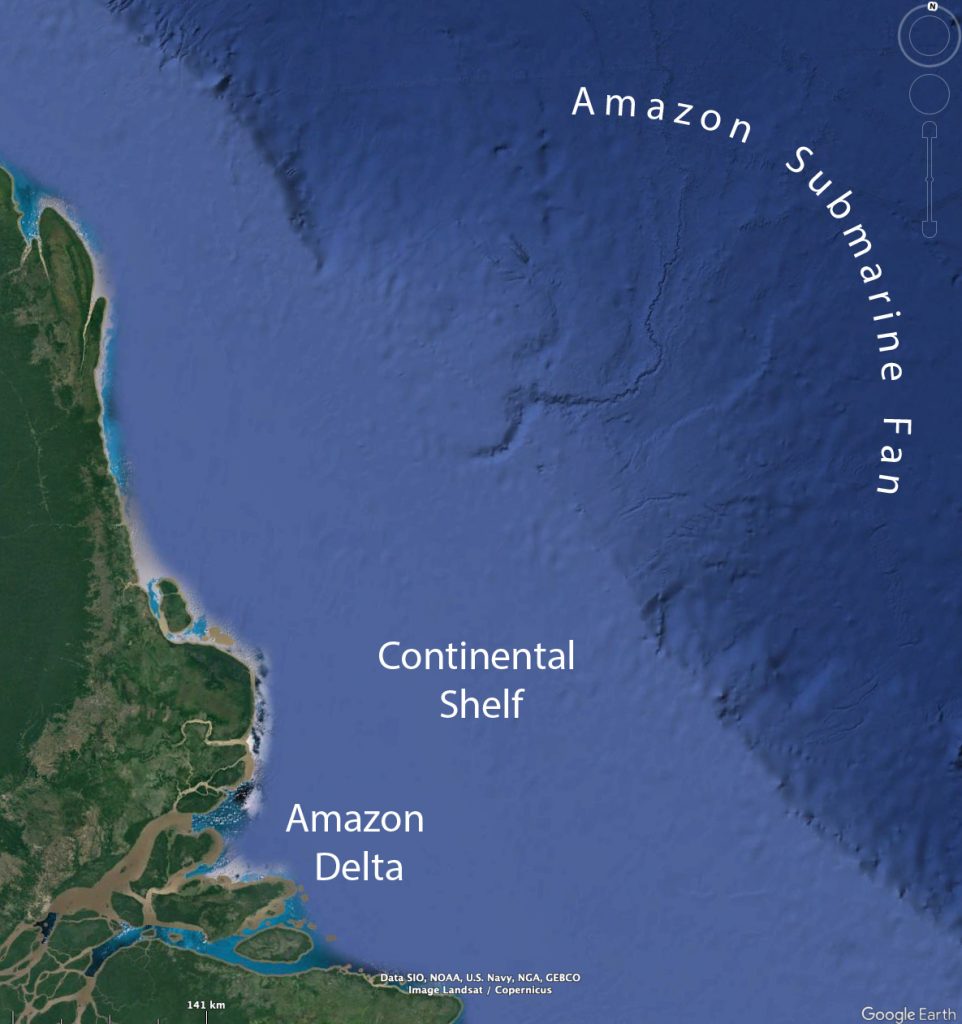
As they move onto lower gradients, in a region called the continental rise, turbidity currents slow down and deposit sediments in submarine fans. These have a geometry somewhat resembling alluvial fans on land, but with gentler slopes and much wider extent. Many of the world’s major rivers are associated with major submarine fans, hundreds of kilometres across, at the foot of the continental slope offshore of the river mouth. The Mississippi, the Amazon, the Nile, and the St. Lawrence river are all associated with submarine fans farther offshore.
Pelagic sedimentation
On the floor of the open ocean, beyond the reach of most terrigenous sediment, fine-grained sediments settle out slowly from suspension, accumulating sediment on the deep ocean floor. These sediments come from two main sources. Deep-sea clay is the finest-grained clastic sediment derived from the continents and from volcanic islands. Pelagic ooze is fine-grained material derived from living organisms that mainly live in the photic zone in the surface waters of the ocean. Two main types of ooze are recognized.
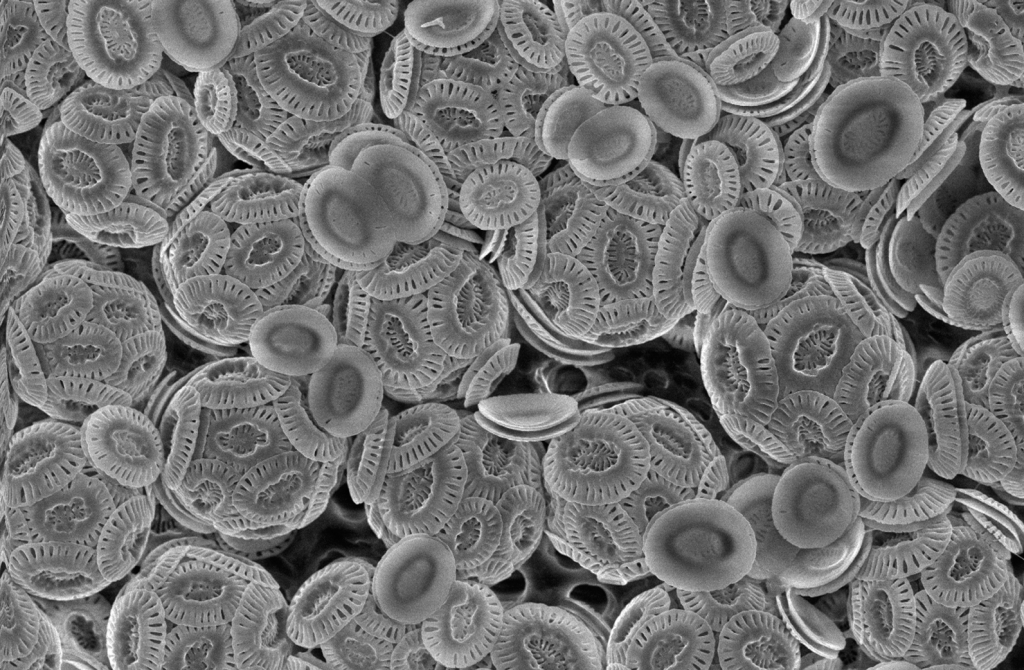
- Calcareous ooze consists of the calcium carbonate (CaCO3) skeletons of single-celled animals (mainly a group called planktonic foraminifera), and single celled plants (mainly a group called coccolithophores that produce small calcium carbonate plates called coccoliths). These accumulate over large areas of the ocean basins at moderate depth (1-4 km). Ancient coccolith ooze makes a soft limestone called chalk. Calcareous ooze is less abundant in the deepest parts of the ocean basins because deep ocean water is undersaturated with calcium carbonate, so these tiny skeletons may dissolve before they reach the bottom.
-
Radiolaria. By Frank Fox – http://www.mikro-foto.de, CC BY-SA 3.0 de, https://commons.wikimedia.org/w/index.php?curid=20228896 Siliceous ooze consists of silica (SiO2) in the form of opal which has a disordered atomic structure akin to glass. Siliceous ooze is also derived from two groups of organisms. Single-celled silica-secreting animals called Radiolaria are abundant in the equatorial ocean waters and settle to the bottom forming radiolarian ooze. A group of single-celled plants, the diatoms, also produces opal skeletons. They live mainly in cold northern and souther ocean waters and accumulate as diatomaceous ooze nearer to the poles. These forms of siliceous ooze are most common on the deepest parts of the ocean floor
Sediments to rocks
Sediments deposited in the oceans are much more likely to be preserved as sedimentary rocks than those deposited on land, because much of the land surface is periodically eroded away, whereas piles of sediment kilometres thick are able to accumulate on the sea floor. Therefore, we meet many of these types of sediment again when we look at sedimentary rocks of the Geosphere.
- Clarke, F.W. 1924 The Composition of the River and Lake Waters of the United States. USGS Professional Paper 135 ↵
- In mid-20th century work these were sometimes called "tidal waves". This term is now largely abandoned because tsunami waves have nothing to do with tides. ↵
- This drag is sometimes described as 'friction' or 'liquid friction' but the physcally correct term for it is viscous drag, caused by the resistance of water to shearing flow. True friction acts between solid surfaces and is very dependent on pressure; viscous drag in fluids is almost independent of pressure. ↵
- This effect may be slightly offset by the convergent plate boundaries that are marked by deep ocean trenches. However the trenches are narrow, and their volume is less affected by the rate of plate movement, so the offset is minor. ↵
- Liviu Giosan, et al., “Young Danube delta documents stable Black Sea level since the middle Holocene: Morphodynamic, paleogeographic, and archaeological implications.” Geology 34.9 (2006), 757-760Liviu Giosan, et al., “Early Anthropogenic Transformation of the Danube-Black Sea System”, Scientific Reports 2 (2012), 10.1038/srep00582Luminiţa Preoteasa, et al., “Coastal changes from open coast to present lagoon system in Histria region (Danube Delta).” Journal of Coastal Research 65 (2013), 564-569Filip Florin, Liviu Giosan, “Evolution of Chilia lobes of the Danube delta: Reorganization of deltaic processes under cultural pressures”. Anthropocene 5 (2014), 65–70Guénaëlle Bony, et al., “History and influence of the Danube delta lobes on the evolution of the ancient harbour of Orgame (Dobrogea, Romania)”. Journal of Archaeological Science 61 (2015), 186-203Luminiţa Preoteasa, et al., “The evolution of an asymmetric deltaic lobe (Sf. Gheorghe, Danube) in association with cyclic development of the river-mouth bar: Long-term pattern and present adaptations to human-induced sediment depletion”, Geomorphology 253 (2016), 59–73 ↵
Describes maps of the ocean based on seafloor depth.
The zone of the shore that is exposed to air dry during low tide, but submerged during high tide.
The zone of the ocean that is covered by water at all tidal stages directly above the continental shelf, with a maximum depth of about 200 metres.
The reagion beyond the continental shelf, where water depth is greater than 200 m.
Referring to the ocean’s bed, and the fauna that live there.
Describes the open water column of the ocean; the environment away from the seafloor in which planktonic and nektonic organisms live.
Relating to the zone where sunlight can penetrate into a waterbody.
Describes the zone in the ocean where no light penetrates
The concentration of dissolved salts in water.
The depth zone within the ocean’s where the greatest rate of downward temperature decrease is observed.
The segment of the ocean’s depth where the most rapid increase in salinity with depth.
The zone within the ocean’s where there is the greatest rate of increase in density with depth occurs.
Deep ocean currents driven by differences in temperature and salinity.
Containing a high concentration of dissolved salts
Ocean currents at the top of the top of the water column, caused by wind and tides, additionally deflected by the Coriolis effect.
Circular movements of a fluid; typically applied to Coriolis-driven movements in the Atmosphere and oceans.
Westward currents (easterly in mariner's terms) formed by the movement of gyres north and south of the Equator.
A west-to-east (in mariner's terms, westerly) current that flows along the equator, opposite to the north and south equatorial Currents.
An eastward current formed by the movement of oceanic gyres north of Antarctica.
A combination of thermohaline and surface currents in the North Atlantic that transports warm water from SW to NE, warming Europe.
The helical path of a downward water stream due to the Coriolis effect
The net transport of water at 90 degrees an the original wind direction as a result of the Coriolis effect.
Rise of deeper water to the surface, typically due to Ekman transport that forces water away from a coasts.
A downward flow of water, typically due Ekman transport that forces water towards a coast
Warming of the central and east Pacific Ocean surface resulting in the supression of normal December upwelling off the coast of South America
A tidal phenomenon caused by the alignment of the Moon, Sun, and Earth along a single line, producing a maximum tidal range and accentuating tidal effects.
A tidal phenomenon caused by a 90 degree angle between the Sun and the Moon, resulting in reduced tidal range.
The vertical distance between high and low tide levels at a point on the Earth's surface.
The distance over which wind can blow across the surface of a body of water to develop waves.
The maximum depth below the water surface at which sediment is affected by motion from waves.
The distance between the two successive maximum values or crests in any wave-like phenomenon.
The coastal area in which wave crests move faster than deeper water inhibited by drag against the seafloor. As a result, turbulence occurs as waves break over one another.
At right angles or 90°
Diagonal; at an angle that is not a multiple of 90°.
A phenomenon affecting all kinds of waves, whereby waves impinging obliquely on a boundary where their velocity changes experience a change in the direction of wave propagation
the gradual movement of water parallel to the shore resulting from obliquely impinging waves.
A narrow current of water flowing offshore, supplied by longshore currents.
The transportation of sediment by longshore currents.
Relating to global sea level, and its rise and fall through time
Masses of ice capable of slow movement over the land surface
A large masses of glacial ice unconstrained by topography.
Small (<50,000 km²) areas of continental ice cover that are not confined by topograpy.
A plate boundary where plates are moving apart, away from the boundary
An era in the Phanerozoic Eon of Earth history, from about 200 Ma to about 65 Ma
The layer of the mantle lying beneath the lithosphere and capable of plastic flow
A measure of the resistance of a fluid to shearing; measured as the force concentration needed to achieve a given velocity gradient. In everyday terms, a measure of hhow 'thick' a fluid is.
A partially enclosed bay or river mouth in which freshwater and seawater mix
A sediment deposit formed from the flow of a channel into a standing water body.
Reduction in volume of a sediment or soil due to the expulsion of air or water
Hydrothermal describes groundwater that has been heated by geothermal energy
