
7.3 Introduction to Graphic Logs
Stratigraphic logs, or graphic logs, are a visual representation of observations made in the field. These provide a standard way to record data from successions of sedimentary rocks, and are an important tool for characterizing the relative ages of rocks. The advantages of recording observations as a graphic log are:
- The ability to summarize a lot of data in a simplified form,
- The visualization of the complete vertical succession of strata,
- The ease with which patterns, repetitions, and major changes in sedimentary strata can be recognized,
- Convenience when making correlations between strata of similar age from other field sites.
While graphic logs are a standard way to represent field data from sedimentary strata, there are many variations in the style and layout. Many stratigraphers have a set format that suits their specific research goals and personal style. We will use a simplified template to create a graphic log in today’s lab.
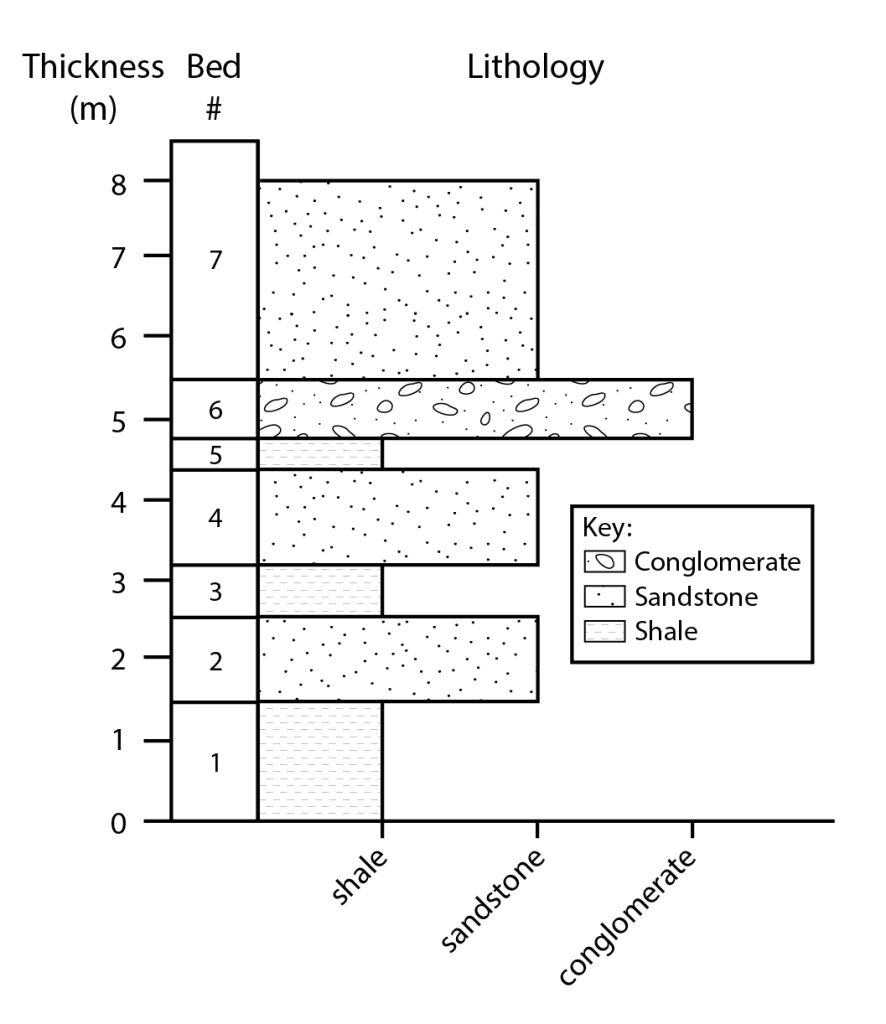
For this lab, we will be focusing on a few key elements of a graphic log. These include the vertical scale, the horizontal scale, and the lithology of the rocks themselves (Figure 7.3.1).
Vertical Scale
Most graphic logs have a vertical scale that represents the cumulative thickness above a specific datum (i.e., the base of the exposed outcrop), where distance above the datum increases upwards (unless the graphic log is being produced based on drill core or bore hole data, in which case the distance increases downwards). Since these logs can be used to document successions that are centimetres to even kilometres thick, the scale factor is variable. Often easy-to-use scales are selected for simplicity, for example 1:100, meaning that 1 cm on the vertical scale represents 100 cm or 1 m of rock.
Horizontal Scale
For clastic sedimentary rocks, this scale is always related to the average size of the grains. Typically, grain size is formatted to show increasing grain size towards the right. The horizontal scale for chemical sedimentary rocks is less straightforward. For carbonate rocks like limestone, the scale is typically drawn to show decreasing amounts of carbonate mud (micrite) towards the right; however, other horizontal scales for limestones that do not employ this convention do exist. Other chemical sedimentary rocks (i.e., rock salt, rock gypsum) may not require a full horizontal scale, as it may only be necessary to express those rocks as a single rock type in the graphic log.
Lithology
Lithology is a term that describes the general physical characteristics of a rock. As an example, stating that a rock is a “sandstone” or a “limestone” is essentially making a reference to its lithology. While lithology is most commonly expressed in a graphic log using grain size, it can also be documented using symbols and/or fill patterns. Examples of methods that geoscientists use to express lithological changes in a graphic log are shown in Figure 7.3.1.
Media Attributions
- Figure 7.3.1: © Benjamin Daniels. CC-BY-4.0.
