
2.2.1 Checklist Accessible Textbooks
What does accessibility of content entail?
When creating learning materials, it is recommended to take a proactive approach so as to make them accessible to all learners by default including those who:
- have a learning disability
- are in a location where they cannot play or her audio
- are not native English speakers and need written-word formats to support understanding
- have a physical disability (as listed below)
- are blind or have low vision
- have poor contrast vision
- are deaf or hard of hearing
- are colour blind and cannot differentiate between certain colours
- are using a device with monochrome display
- have a form of cognitive disability
The guiding questions presented for each of the content items will detail what makes them accessible. For your convenience, you can download a one-page checklist for quick reference on the bottom (content menu item 8).
Empathy
While you create content, consider how your choices will impact your users by asking yourself:
- Is everybody able to perceive the information you provide or do you exclude people by only offering one means of accessing the information (seeing, hearing, etc?)
- Is everyone able to navigate and interact with the content? Does my content require only one means for interacting with the information (e.g. mouse, keyboard, touch gestures)?
- Is everyone able to understand the content? Does my content include definitions of key terms and other language supports? Is my content written in plain language?
Content Menu
Documents, Presentations, Online Learning Environments, etc.
- Organizing Content
- Images/ Charts/ Graphs/ Maps
- Formulas
- Links
- Multimedia
- Tables
- Text
- One-Page Checklist for Download
- References
 Examples
Below each of the checklist questions, you will find examples that contextualize the information.
1 Organizing Content
Planning your design will help your users focus on the meaning of the content rather than the ways in which it is presented:
- Do you use a logical reading order for multiple elements including text, images, graphs etc.?
- Do you use headings to indicate hierachy and structure?
- Do you use a simple background to minimize distraction?
Example Chapter
A closer look at this chapter will show you that it is a representation of all recommendations presented below.
2 Images/ Charts/ Graphs/ Maps
Descriptions or alternative text shortened to ‘alt text’ for your image elements not only ensure access for blind people, but can also help make complex representations easier to understand. Alternative text must convey the content and purpose of your visual element and is rarely a literal description.
- Does your image serve a functional purpose, i. e. conveys non-textual content to the students?
- Do your alt texts describe the content of the image or their function in concise a way as possible? The recommendation is to provide 1-2 sentences for simple images and more detailed descriptions for complex charts, graphs and maps. Significance is more important than visual features. See the example below for details.)
- Do your images, graphs, charts, and maps also include contextual or supporting details in the text surrounding the image? The recommendation is to keep this short and provide a link to a longer text description on a separate page.
- Do you rely on colour to convey information? The recommendation is to not choose colour for communication of meaning.
- Do you include images that are purely decorative? Those will not need alt text, but can be marked as decorative.
- Do you avoid redundancy of content in alternative descriptions? There is no need to include information like “image of…” as assistive technology recognises the medium. Information appearing in text next to visual elements doesn’t need to be repeated in alt text.
Examples:
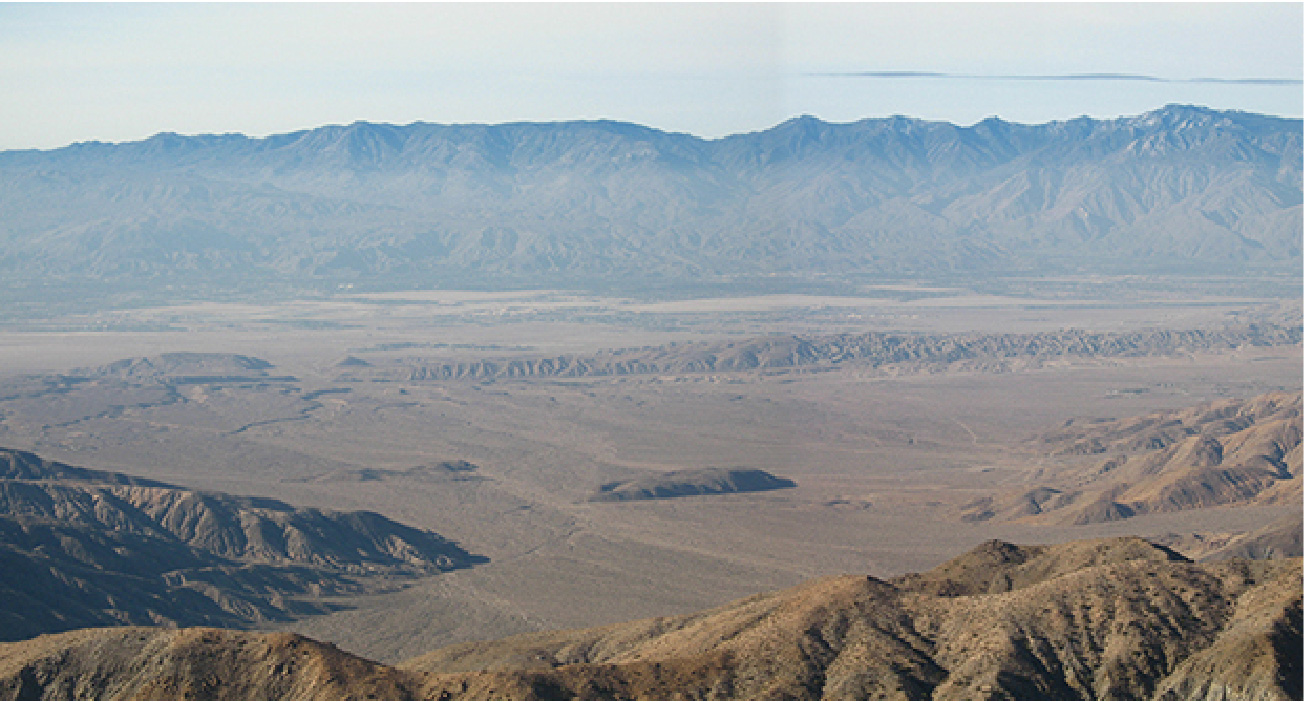
Picture 1 with a short description.
taken from Calculus Volume 1, Introduction
Picture 2 with a longer description
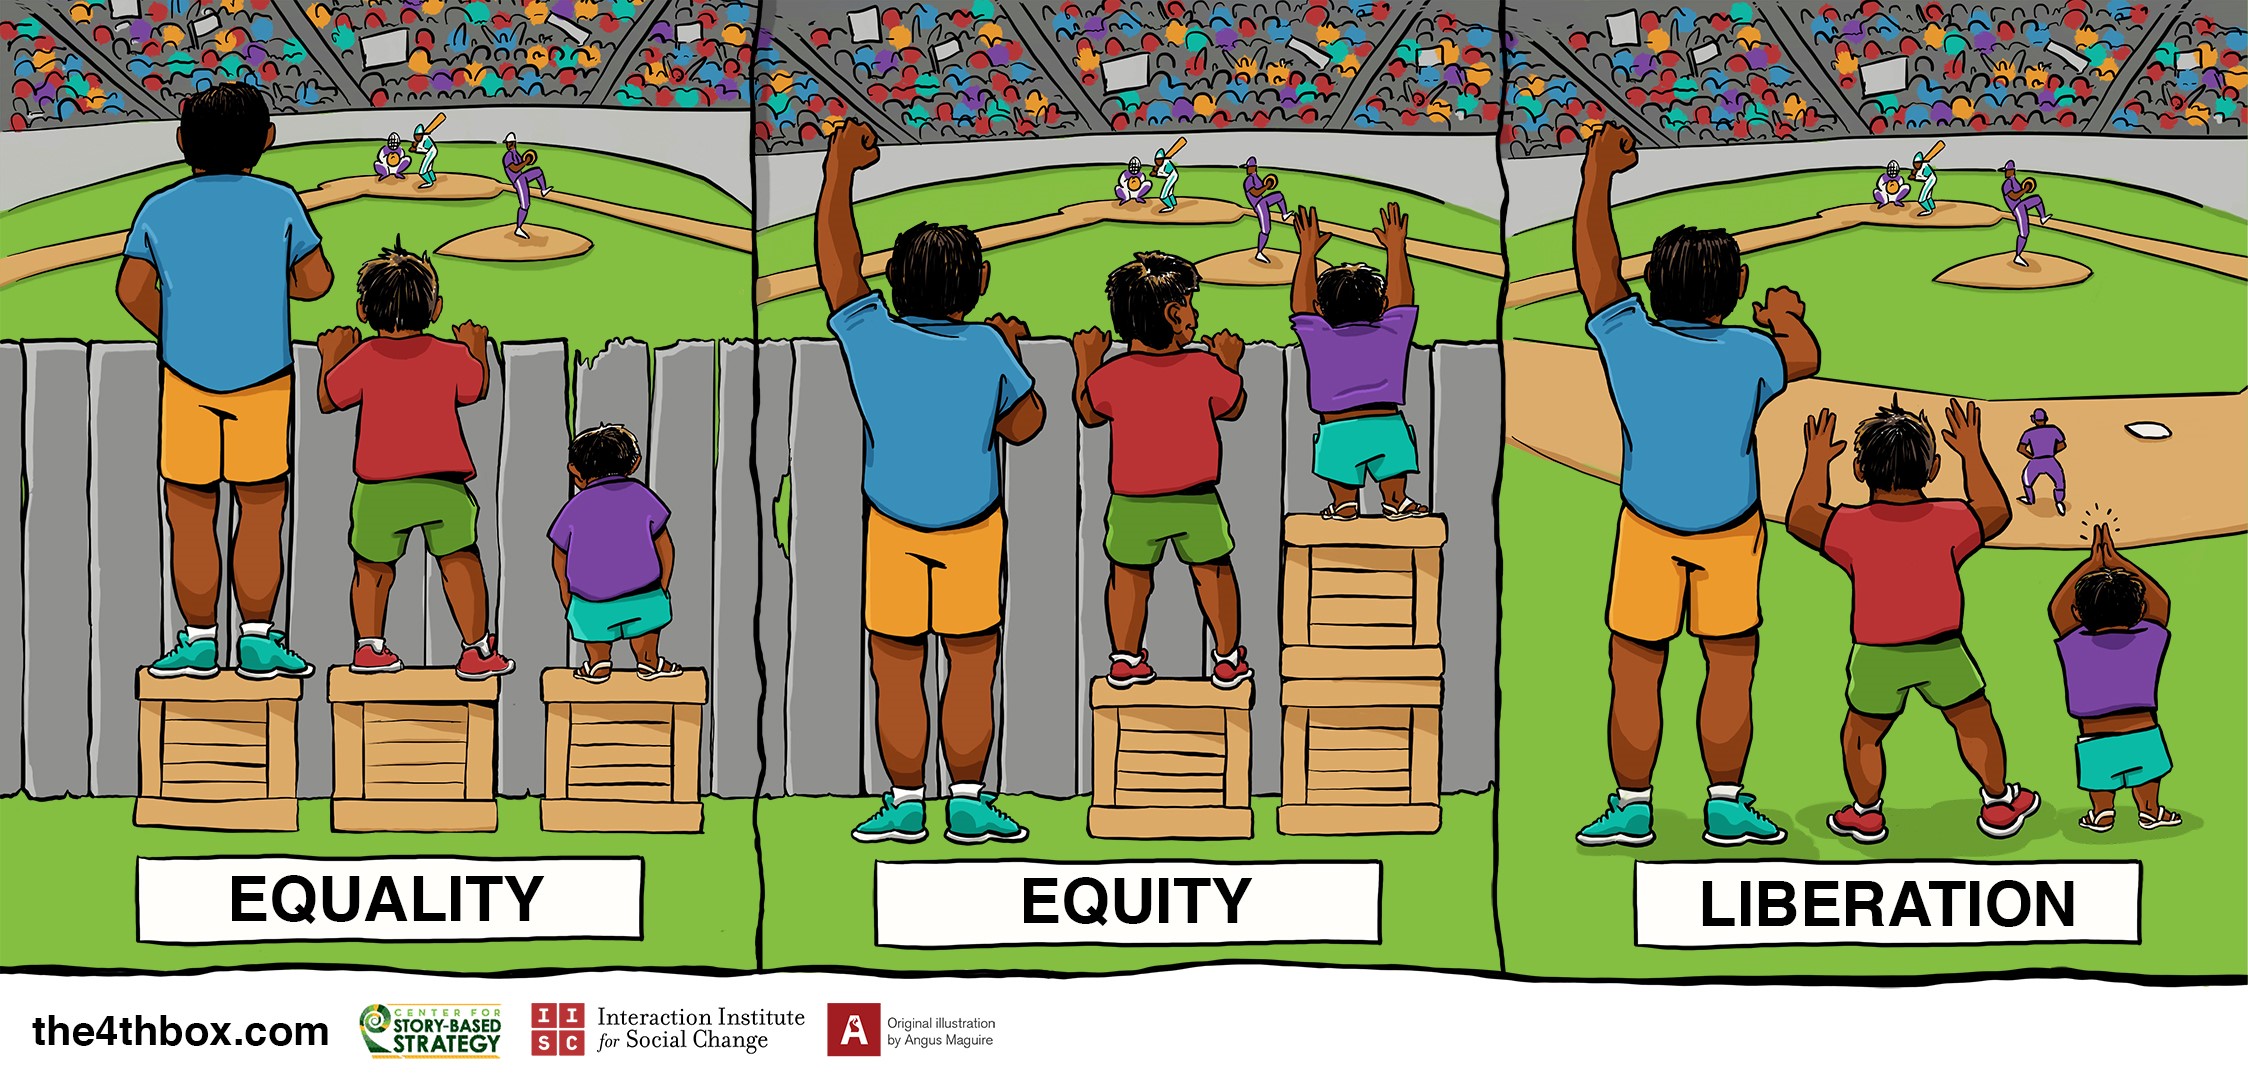
Alt text used by screenreaders: Three scenarios are shown to explain 3 different approaches to accessibility – that of equality, equity and liberation [long description link connecting to separate part at the end of chapter].
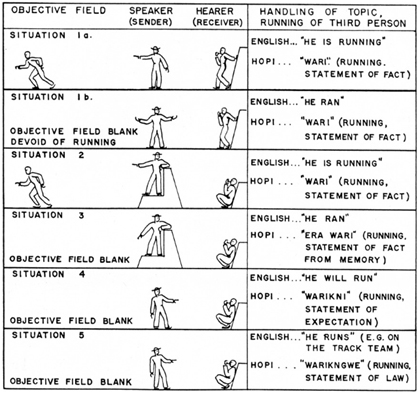
Chart 3 with a short description
taken from Perspectives: An Open Introduction to Cultural Anthropology, Chapter 3 Doing Fieldwork
Map 4 with a short description
taken from Mapping, Society and Technology Chapter 1

3 Formulas
- Do you use applications like MathML[new tab] or LaTeX [new tab] to create your formulas?
- Do you treat inaccessible formula output as images and create alt text information form them?
Examples
Example Formulas 1
taken from Introductory Statistics with Interactive Spreadsheets Chapter 6. F-Test and One-Way Anova
Years ago, statisticians discovered that when pairs of samples are taken from a normal population, the ratios of the variances of the samples in each pair will always follow the same distribution. Not surprisingly, over the intervening years, statisticians have found that the ratio of sample variances collected in a number of different ways follow this same distribution, the F-distribution. Because we know that sampling distributions of the ratio of variances follow a known distribution, we can conduct hypothesis tests using the ratio of variances.
The F-statistic is simply:
where s12 is the variance of sample 1. Remember that the sample variance is:
Example Formulas 2
taken from Simulator Laboratory Chapter 1 Boiler Thermal Efficiency
Next we express the Boiler Thermal Efficiency as follows:

Where energy to steam is the heat transfer required to form steam. Let,
h2=specific enthalpy of steam formed, [kJ/kg],
h1=specific enthalpy of feed water, [kJ/kg].
Because the steam is formed at constant pressure, heat transfer required to form 1 kg of steam in the boiler is
Energy to Steam= (h2-h1) [kJ]
Energy from fuel is computed from the mass of fuel used and its heat (calorific) value. For coal this is the heating value as measured in a bomb calorimeter and it corresponds to the internal energy of combustion. If
mf= mass of fuel burned in a given time
ms= mass of steam generated in the same time
HV= heat value of fuel [kJ/kg]
Energy from fuel= mf x HV [kJ]
Then we can write:

4 Links
Link text should be unique and decriptive:
- Are your links meaningful in context and do not use generic text such as “click here” or “read more”?
- Do links that open in new windows or tabs include a textual reference in the link information (e.g., [NewTab])?
Example Links
from Technical Writing Essentials Chapter 2.1 Key Concept
For further reading, see “Communication in the Workplace: What Can NC State Students Expect?” a study based on the responses of over 1000 professionals from various fields, including engineering, on how important business, technical and scientific communication is to their work.
This work is included with permission and is licensed under a Creative Commons Attribution 4.0 International License.
5 Multimedia
- Is a transcript available for each multimedia resource including relevant non-speech content that include the following?
- speaker’s name
- all speech content
- relevant descriptions of speech
- descriptions of relevant non-speech audio
- headings and subheadings
- Are captions of all speech content and relevant non-speech content included in the multimedia resource; in which the audio is synchronized with a video presentation?
- Are audio descriptions of contextual visuals (e.g., graphs, charts) included in the multimedia resource?
Example Video Resource
taken from Concepts of Biology – 1st Canadian Edition Chapter 1.1 Themes and Concepts
6 Tables
- Do your tables include row and column headers?
- Do the row and column headers have the correct scope assigned?
- Do the tables include captions?
- Do your tables avoid merged or split cells?
- Do the tables have adequate cell padding?
Example
taken from Vaccine Practice for Health Professionals: 1st Canadian Edition. Chapter 1
Table 1.1: Vaccine Types
| Vaccine type | Vaccines |
|
Live-attenuated
|
Measles, mumps, rubella (combined vaccine)
Varicella (chickenpox), Zoster (shingles) Influenza (nasal spray) Oral Polio Vaccine (OPV) Rotavirus Yellow fever |
|
Inactivated/Killed
|
Polio (IPV)
Hepatitis A Rabies |
|
Toxoid (inactivated toxin)
|
Diphtheria
Tetanus |
|
Subunit/Conjugate
|
Hepatitis B
Influenza (injection) Haemophilus influenza type b (Hib) Human papillomavirus (HPV) Pertussis Pneumococcal Meningococcal Zoster (shingles) |
7 Text
When conveying written information, consider the organization of your text:
- Is your content is organized under headings and subheadings?
- Are headings and subheadings are used sequentially (e.g., Heading 1, Heading 2)?
- Are you avoiding to use colour to communicate meaning?
- Do you ensure sufficient contrast between text and background? (Free contrast checker tools like https://www.tpgi.com/color-contrast-checker/ can help)
- Is your font legible? (Recommended fonts include sans serif, verdana, etc.)
- Is your font size 12 point or higher for body text?
- Is your font size 9 point for footnotes or endnotes?
- Can your font size be zoomed to 200%?
8. One-Page Checklist for Download
You can download a one-page word document by clicking on the link: Accessibility Checklist.
References:
AEM. Getting Started with Presentation Accessibility [handout]. https://aem.cast.org/binaries/content/assets/aem/creating-aem/getting-started-with-presentation-accessibility.pdf
Coolidge, A., Doner, S., Robertson, T., & Gray, J. (2018). Accessibility Toolkit—2nd Edition. BCcampus – OpenEd. https://opentextbc.ca/accessibilitytoolkit/
University, R. (2017). Ryerson Open Textbook Authoring Guide. Ryerson University. https://pressbooks.library.ryerson.ca/authorsguide/
Digging Deeper (Further Readings)
Media Attributions
- A photograph of an earthquake fault is licensed under a CC BY-NC-SA (Attribution NonCommercial ShareAlike) license
- Equality-Equity-Liberation
- fieldwork_figure_5
- reference map of China © In the public domain in the United States because it is a work prepared by an officer or employee of the United States Government as part of that person’s official duties under the terms of Title 17, Chapter 1, Section 105 of the US Code. is licensed under a Public Domain license
